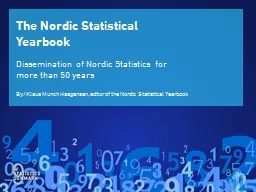
earbook Dissemination of Nordic Statistics for more than 50 years ByKlaus Munch Haagensen editor of the Nordic Statistical Yearbook 19622012 2 Comparable national statistics Relevant to Nordic ID: 650206
Download Presentation The PPT/PDF document "The Nordic Statistical Y" is the property of its rightful owner. Permission is granted to download and print the materials on this web site for personal, non-commercial use only, and to display it on your personal computer provided you do not modify the materials and that you retain all copyright notices contained in the materials. By downloading content from our website, you accept the terms of this agreement.
Slide1
The Nordic Statistical Yearbook
Dissemination
of Nordic
Statistics
for more
than
50
years
By/Klaus Munch Haagensen, editor of the Nordic Statistical YearbookSlide2
1962–20122Slide3
Comparable national statisticsRelevant to Nordic co-operationRelevant for an international audienceEasy to understandThe aim
3Slide4
The book back thenSlide5
The book now5Slide6
http://www.dst.dk/norddb/heal18The book now6Slide7
The database, the book and the web todayThe database Free access via the webContains time series from 1990 and onwardCovers more subjects than the book
Definitions and glossary
Data can be downloaded in many different formatsSlide8
The database, the book and the web todayThe book Free access as a pdf fileSimple tables and diagrams in colour
Links to tables (matrices)
Descriptive texts and explanations
Did you know that…
Maps, pictures, international
comparisonsSlide9
The database, the book and the web todayThe Nordic countries in figuresAd hoc statisticsSlide10
DescriptionBackground – or general informationNordic characteristicsGeneral developments and/or policiesComments on trends
Simple graphs and tables
Only a few variables in the tables and graphs
Short
headlines
The basic principles
10Slide11
Climate
by reporting country and places, time and temperature by time, temperature and reporting country and
place
Temperatures in the
Nordic countries
Climate
in the Nordic
countries
by time,
temperature
and
location
Short
titles
?
11Slide12
No printed version of the bookPrinted ”teasers” like the Nordic countries in figuresNew database on www.norden.orgDynamic diagrams/graphs/tables
placed in relevant spots on norden.org
2014 and
onwards
12Slide13
Explanations and descriptive texts on the web pageDirect links to the databaseMore international comparisonsSome type of (smart) print option
More ”press releases”
2014 and
onwards
13Slide14
The new database14
norden.statbank
StatistikbankenSlide15
The new databaseSlide16
The matrices16Slide17
17The indicator shows the share of taxes with a primary environmental goal as a share of total tax revenues. Environmental taxes are split into taxes on transport, energy taxes and taxes on pollution and resources.Graphs from the new database
Denmark – Environmental taxes as share of total taxesSlide18
Environmental taxes have shown a declining tendency from year 2000 till today in Denmark, Iceland and the EU27. In Sweden and Finland there has been a modest rise. Environmental taxes in the Nordic countries range from 5.4 per cent of the tax revenue in Iceland to 8.5 in Denmark.In all the countries taxes on energy have the highest share of environmental taxes, with taxes on transport coming second and taxes on pollution and resources only accounting for a minimal share of total taxes. However, taxes on transport are still substantial in Denmark and Finland.
Comments on the figures
18Slide19
Thanks for listening!
19
Contact information:
nordisk@dst.dk
Klaus Munch Haagensen:
kmh@dst.dk