/
B Africa Rainfall Climatology Version  Nicholas Novell B Africa Rainfall Climatology Version  Nicholas Novell

B Africa Rainfall Climatology Version Nicholas Novell - PDF document

natalia-silvester
natalia-silvester . @natalia-silvester
Follow
398 views
Uploaded On 2015-05-16

B Africa Rainfall Climatology Version Nicholas Novell - PPT Presentation

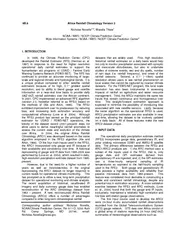
6 Africa Rainfall Climatology Version 2 Nicholas Novella 12 Wassila Thiaw NOAA NWS NCEP Climate Prediction Center Wyle Information Systems NOAA NWS NCEP Climate Prediction Center 1 INTRODUCTION In 1998 ID: 67721

Africa Rainfall Climatology Version

Share:

Link:

Embed:

Download Presentation from below link

Download Pdf The PPT/PDF document "B Africa Rainfall Climatology Version N..." is the property of its rightful owner. Permission is granted to download and print the materials on this web site for personal, non-commercial use only, and to display it on your personal computer provided you do not modify the materials and that you retain all copyright notices contained in the materials. By downloading content from our website, you accept the terms of this agreement.


Presentation Transcript

9B.6 Africa Rainfall Climatology Version 2 Nicholas Novella* 12 , Wassila Thiaw 1 NOAA / NWS / NCEP/ Climate Prediction Center 1 Wyle Information Systems / NOAA / NWS / NCEP/ Climate Prediction Center 2 1. INTRODUCTION In 1998, the Climate Prediction Center (CPC) developed the Rainfall Estimator (RFE) (Herman et. al. 1997) in response to the need for higher resolution operational daily rainfall estimates to support the humanitarian aid programs of USAID / Famine Early Warning Systems Network (FEWS - NET). The RFE has continued to provide an accurate monitoring of large - scale and regional climatic and hydrological trends. It is a unique product compared to other satellite rainfall estimators because of its high, 0.1° gridded spatial resolution , and its ability to blend gauge and satellite information on a near - real time basis to provide daily (06Z - 06Z) rainfall estimates over the African continent. In 2001, CPC implemented an advanced RFE algorithm (version 2.0, hereafter referred to as RFE2) based on the methods of (Xie and Arkin, 1996). The RFE2 exhibited improvement over its predecessor by reducing bias, and increasing both estimation accuracy and computational efficiency (Love et al. 2004). Although the RFE2 product has served as the prin cipal rainfall estimator for USAID / FEWS - NET operations, the brevity of the dataset record (2001 - present) does not allow users to derive meaningful rainfall anomalies to assess the current state and evolution of the climate over Africa. In 2004, the orig inal Africa Rainfall Climatology (ARC1) was developed based on the same algorithm employed in the RFE2 algorithm (Xie and Arkin, 1996). Of the four main inputs used in the RFE2, the ARC1 incorporated only gauge and IR because of their availability and con sistency over time. A historical reprocessing of gauge and IR data from 1995 - 2005 was performed by (Love et. al. 2004), which resulted in daily, high - resolution precipitation estimate dataset from 1995 - present. However, due to the need for a higher numb er of years as well as inconsistencies in the original reprocessing, the ARC1 dataset no longer responds to current needs for operational climate monitoring. This has prompted us to utilize a new, long - term precipitation dataset for operational monitori ng and climate analysis. The recent acquisition of historical, recalibrated IR imagery and daily summary gauge data has enabled reconstruction of the ARC climatology dataset from 1983 – present. A new, reconstructed Africa Rainfall Climatology (ARC2) offe rs a number of advantages compared to other long - term climatological rainfall Corresponding author address : Nicholas Novella, NOAA/Climate Prediction Center, Rm 811 - D, 5200 Auth Rd. Camp Springs, MD 20746; email: Nicholas.Novella@noaa.gov datasets tha t are widely used. First, high resolution historical rainfall estimates on a daily basis would help not only to monitor precipitation associated with synoptic and mesoscale disturbances, but also to undertake studies of extreme events, wet and dry spells , number of rain days (i.e. rainfall frequency), and onset of the rainfall seasons. Second, a 0.1° (~10km) spatial resolution allows users to see rainfall phenomenon on local scales that cannot be captured by coarser climate datasets. For the FEWS - NET pr ogram, this local scale resolution has also been instrumental in assessing impacts of rainfall on agriculture and water resource management. Third, the ARC2 maintains the same two inputs that remain continuous and homogeneous over time. This straight - for ward estimation approach is expected to minimize the possibility of introducing bias associated with new satellite sensors. Lastly, because the same algorithm as the operational RFE2 is used, ARC2 precipitation estimates are also available in near real - ti me, allowing the dataset to be routinely updated on a daily basis. All of these features make the new ARC2 dataset unique. 2. INPUT DATA The operational daily precipitation estimate method (RFE2) incorporates gauge data, geostationary IR, and polar orbiting microwave SSM/I and AMSU - B satellite data. The primary differences between the RFE2 and ARC1/ARC2 products are: 1) the ARC method use s a subset of the inputs used in the RFE2, that is, only gauge data and GPI estimates derived from geostationary IR are ingested, and, 2) the GPI estimates use a three - hourly temporal sampling of IR temperatures as opposed to the half - hourly sampling used in the RFE2. Both gauge and geostationary IR data possess a higher availability and reliability than passive microwave data from 1983 - present. This feature was considered most desirable in constructing a stable and consistent rainfall climatology, despi te any potential loss in estimation accuracy. A cross validation exercise between the RFE2 and ARC methods, (Love et. al., 2004) found that both the gauge and IR inputs, exclusively, maintained a relatively high correlation and low bias with station gauge observations. The first input source used to develop the ARC2 were 24 - hour in - situ accumulated rainfall observations recorded from the Global Telecommunications System (GTS) gauge network. GTS data over Africa consist of a global array of stations repor ting 24 hour (06Z - 06Z) summaries of meteorological observations such as Figure 1: Spatial mean of annual ARC2 rainfall (mm/day) at a 0.1° resolution over Africa from 1983 - 2010. temperature max/mins, winds, precipitation, etc. For the ARC2, we combin ed the existing GTS gauge database at CPC with historical daily GTS data extending back to 1983. The historical GTS data from 1983 - 1994 were acquired from the archives at UCAR in daily summary file format. These daily summary files were reformatted to ma tch the currently assimilated GTS format ingested by the RFE2 algorithm in order to build a daily GTS gauge record from 1983 - present. Out of an approximate 7500 GTS gauges that exist globally, less than 1200 stations typically report in Africa on a daily basis. This accounts for about a 1:23,000 km 2 gauge to area ratio across the African continent. Despite the paucity of GTS stations and their relatively poor distribution across Africa, this gauge data is still "ground - truth" and remains instrumental in constructing a daily, historical precipitation record. And while the lack of gauge data over Africa is less beneficial when constructing historical precipitation estimates, the near real - time availability of the GTS offers a desired timeliness when gener ating rainfall anomaly fields on an operational basis. Each day, GTS gauge observations are interpolated to 0.1° by 0.1° grid over Africa using the methods of (Shepard, 1968). The second input source are full - disk, Meteosat geostationary Infra - Red (IR) i magery centered at 0° longitude using the 10.5 - 12.5 historical three - hourly IR imagery for Meteosat First Generation (MFG) satellites 2 through 7 was collected from EUMETSAT via ftp transmission at CPC. Fr om 2006 onward, pre - calibrated Meteosat Second Generation (MSG) IR data has been continuously forwarded to CPC for operations on a daily basis. The advancement of geostationary calibration methods associated with MSG data led to non - negligible discrepanci es between the MFG and MSG raw IR imagery. This warranted careful treatment of the calibration of MFG raw IR imagery to ensure uniformity Figure 2: Annual cycle of ARC2 rainfall (mm/day) over Africa domain. with the total IR input record from 1983 - p resent. The recalibrated MFG IR data from 1983 to 2005 is what mainly distinguishes the new ARC2 from the original ARC1 dataset. 3. METHODS The methodology used to develop ARC2 consisted of compiling 23 years of daily GTS gauge data and three - hourly IR data from 1983 to 2005, similar to (Love et. al. 2004) in the initial reprocessing of the ARC1 dataset (1995 - 2005). In ARC2, however, much of the work was devoted to correctly calibrating all MFG IR data from 1983 - 2005, and then perform the daily repro cessing using the operational RFE2 algorithm for this period. 3.1 IR Calibration and GPI Open Meteosat Transition Program (OpenMTP 1.5) files from EUMETSAT’s UMARF satellite data archive were selected as the best available IR format to cover the main rec onstruction period from 1983 - 2005. In order to preprocess the raw three - hourly IR data, calibration coefficient and space count values were first required to convert the raw digital data counts to brightness temperatures for all MFG satellites. The calib ration relation is expressed as: R = CC (C nt – SC) where (R) equals the radiance, and (CC), ( C nt ) and (SC) correspond to the calibration coefficient, digital Meteosat counts, and space counts, respectively. An analytic relationship derived from Planck’s law was applied to explain the relationship between radiance (R) and brightness temperatures (T b ). T b = B / ( ln(R) – A ) EUMETSAT provided semi - daily CC and SC data on a separate online source ( EUMETSAT , 2011). In determining the values of constants A and B, radiance Figure 3: Time series of monthly areal averaged ARC2 rainfall (mm/day) compared to ARC1, GPCP and CMAP from 1983 - 2009. and brightness temperature reference tables for each Meteosat satellite from 2 to 7 also provided from EUMETSAT were used . Once all MFG IR data were fully calibrated, the GOES Precipitation Index (GPI) algorithm was used to convert three - hourly brightnes s temperature images to daily rainfall estimates. GPI rainfall is derived from the fractional coverage of cloud - top IR temperatures less than 235°K over a 24 - hour period, which is then multiplied by an empirical rain rate constant of 3.0mm/hour (Arkin an d Meisner, 1987). Historical daily GPI estimates were computed from 06Z - 06Z in order to be concurrent with the daily GTS gauge totals for merging. 3.2 Two - Step Merging Methodology The two - step merging process is the essence of the RFE2 and ARC2 products, as it is here that all inputs are blended and final rainfall estimates are produced. As outlined in (Xie and Arkin, 1996), the first step aims to reduce the random error associated with the satellite input data. For the RFE2, this is performed by linearly combining GPI, SSM/I, and AMSU - B data through a maximum likelihood method. Weighting coefficients for each satellite input are calculated from their random errors which are determined by comparing the estimated precipitation to the actual rain gauge values on a daily basis. These coefficients are inversely proportional to the random error of each satellite input, which grants greater leverage to accurate satellite estimates. However, the exclusion of passive microwave inputs (i.e. SSM/I and A MSU - B) leads to only one weighting coefficient for the GPI in the ARC2. Because the first step contains bias from the original inputs, the second step is designated to remove the bias by blending the first - step output with the gauge data through Reynolds (1988) methodology. Specifically, the bias corrected satellite output was used to define the spatial distribution and extent of rainfall, while the gauge data was used to determine the magnitude of the precipitation fields. Values of gridded precipitati on were calculated by solving a Poisson’s equation, in which the forcing term and boundary conditions were determined from the first - step output and gauge data, respectively. By doing so, the final rainfall estimate for any particular grid point retains a station’s reported value when in close proximity to that station, and greater reliance is placed upon the satellite estimate as distance increases from the station. 4. RESULTS The new, operational ARC2 dataset consists of daily, gridded 0.1° X 0.1° rainfall estimates with a spatial domain of 40°S to 40°N in latitude, and 20°W to 55°E in longitude encompassing the African continent from 1 January, 1983 to present and forward into the future. Figure 1 illustrates the spatial distribution of mean annua l ARC2 rainfall on 0.1° grid over Africa from 1983 - 2010. Mean precipitation maximums greater than 6mm/day are observed along the coastal Gulf of Guinea region, the central African Congo, and over areas surrounding Madagascar in the southwestern Indian Oce an basin. Mean precipitation minimums less than 1 mm/day are seen across the subtropics, which encompasses the Sahara desert in the northern hemisphere, St. Helena’s High in the southern Atlantic, and the semi - arid Kalahari region across continental so uthwestern Africa. Figure 2 is a time series of ARC2 annual cycle of daily rainfall over Africa. Both inter - annual and intra - seasonal variability are present and embedded with extreme rainfall events over the 28 - year record. Climatologically, the annual rainfall maximum over Africa typically develops during the Mar - May season, when convection is extremely active within the Intertropical Convergence Zone (ITCZ) in the Gulf of Guinea region, the Congo rain forest region, and equatorial eastern Africa. This maximum is followed by the annual minimum during the months of May through October when rainfall shifts to the northern tropical belt region (0° to 20°N) between the Sahara desert and central Africa to coincide with the West African Figure 4: Annual Cy cle of mean monthly rainfall for comparison products. m onsoon. After September, the gradual increase in annual mean precipitation is associated with the onset of the rains in central Africa, southern Africa, and equatorial eastern Africa. During this time, the distribution of rainfall is quite robust across much of continental southern hemisphere and the southwestern Indian Ocean basin until approximately April. 4 . 1 Product Inter - Comparison In the following, we compare ARC2 with ARC1, and with three historical long - term precipitation datasets including, the GPCP version 2.1 (GPCP) combined precipitation dataset (Huffman et. al. 1997); (Adler et. al. 2003); (Huffman and Bolvin, 2009), the CPC enhanced version (CMAP) merged analysis of precipitation (Xie and Arkin, 1997), and the 50 - year (PREC/L) monthly global analysis of gauge obs ervations (Chen et. al. 2002). A long - term time series depicting areal averaged monthly and yearly rainfall, as we ll as a monthly annual cycle of precipitation for the domain spanning 40°S to 40°N and 20°W to 55°E between the ARC2, ARC1, GPCP and CMAP products are illustrated in Figures 3a - c. First, in comparing the new ARC2 with the original ARC1, the reconstructed ARC2 shows much improvement over its predecessor with respect to maintaining homogeneity over a long - term record. A large dry bias is evident in the original ARC1 monthly rainfall areal average from 1998 - 2000 that is not seen in the ARC2, GPCP and CMAP data. This erroneous feature is likely attributed to the treatment of historical MFG imagery performed in the original reprocessing. Comparisons of mean monthly GPCP and CMAP rainfall exhibit impressive agreement with the ARC2 from 1983 - 2009. Figure 3 a lso shows that the ARC2 closely follows GPCP and CMAP in terms of year - to - year mean changes in precipitation, with the exception that the ARC2 exhibited on average slightly less rainfall. However, this discrepancy becomes more transparent when comparing the annual cycles of precipitation between the comparison datasets in Figure 4 . While the annual mean curves are very similar between all products, ARC2 maintains a greater decrease in mean rainfall after approximately June. By October, the ARC2 annual mean rainfall becomes more comparable with the GPCP and CMAP products relative to the upward seasonal trend and in total magnitude. The ARC1 annual cycle also follows this pattern, but remains drier overall. From 1983 to 2009, the long - ter m mean spatial distributions of ARC2, GPCP, CMAP and PREC/L were compared. After the ARC2 data was averaged to a 2.5° grid, the new ARC2 agrees with the spatial means of the GPCP, CMAP and PREC/L products. Despite some slight variations relative to the m agnitude of mean rainfall over coastal areas in the Gulf of Guinea region and southwestern Indian Ocean, the overall distribution of the mean rainfall is largely consistent. Another set of time series analyses was again performed using land only rainfall over Africa to compare with the gauge only PREC/L dataset (figures not shown). The ARC2 does well in capturing the inter - annual variability of rainfall similar to the GPCP, CMAP and PREC/L data from 1983 - 2009. However, two key differences are repeatedly observed between the ARC2 and the GPCP, CMAP and PREC/L datasets: (1) the ARC2 appears consistently drier during the northern hemisphere summer from 1983 - 2009, and (2) the rainfall magnitude in ARC2 remains less overall every year. Table 1 shows the ann ual and seasonal mean precipitation values, as well as, the cross data correlation coefficients for all products. ARC2 has high correlations of 0.86, 0.86, and 0.82 with GPCP, CMAP and PREC/L datasets, respectively; however, a noticeable spread in the sea sonal means is evident. This reflects the finding that the June - September timeframe is when the ARC2 disagrees with the other products the most. To diagnose the source region of the disagreement, spatial Table 1: Product inter - comparison of annual and seasonal means (left), and correlation matrix of monthly mean rainfall (right) from 1983 - 2009. Land only values denoted in parentheses. Figure 5a - d: Scatter plots of mean monthly rainfall (mm/ day) averaged over a 2.5° unified grid between GRID and (a) GPCP, (b), CMAP, (c) PREC/L, and (d) ARC2 during June - September from 1997 - 2004. analyses of three - month mean seasonal rainfall were then examined between the ARC2, GPCP and CMAP data . Spatially, the greatest differences in mean July - September rainfall were predominately found across the Gulf of Guinea region . We focus on the Gulf of Guinea region in the diagnosis of the summer rainfall discrepancy between the ARC and the other three datasets. M onthly rainfall means derived from daily gauge measurements at several stations in the Gulf of Guinea region of Africa were used to validate the rainfall estimate datasets. This Gulf of Guinea gauge data (GRID) is independent from the GT S observations in the region and was obtained from various meteorological services in Africa. The development of the GRID gauge dataset consisted of 248 rain gauges covering the Gulf of Guinea and lower Sahel region of West Africa. GRID rainfall were com puted over unified 2.5° grid and compared with the respective rainfall estimates for the 32 summer months of June - September from 1997 - 2004. Scatterplot analyses and validation metrics between the GRID data and the ARC2, GPCP, CMAP and PREC/L data are illus trated in Figures 5 a - d. All products showed reasonable agreement with the independent gauge data, however validation scores determined that the GPCP, CMAP and PREC/L products overall outperformed the ARC2 rainfall estimates. While all products showed a tendency to underestimate high rainfall amounts observed in the GRID data, the ARC2 yielded the highest root mean squared error and qualitative bias during the 32 month validation period compared to the other products. This validation suggested that the s ummer dry bias in the ARC2 dataset is systematic and can possibly be linked to the sparse GTS gauge data that is being ingested on an operational basis. An examination of the daily GTS reporting rates over the Gulf of Guinea region revealed that GTS stations in The Gambia, Guinea - Bissau, Guinea, Sierra Leone, and Nigeria reported only 30% of the time from 1983 to 2009. During the 32 - month validation period with the GRI D data , the lowest reporting rates were 6% in Guinea - Bissau and Sierra Leone, which ranked amongst the lowest compared to all other countries in Africa. A clear linkage between GTS reporting percentages and validation scores from the ARC2 and GRID data wa s found. Areas with low GTS reporting rates were collocated over areas with high RMSE, and areas with low correlations between the ARC2 and GRID data. Conversely, areas with higher reporting rates over 70% further north in the Sahel were associated with l ower RMSE, and higher correlations. A histogram was generated to derive the relationship between GTS reporting rates and the corresponding absolute error seen in the validation between the ARC2 and GRID data. The analysis showed that as GTS reports decr ease throughout parts of the Gulf of Guinea region, the mean absolute error observed with the ARC2 increases. This inverse relationship suggests that the unavailability of gauge data in the Gulf of Guinea region greatly influences the estimation performan ce in the new ARC2 dataset, and likely explains the observed summer dryness compared to the other long - term precipitation datasets. 4.2 Operational Climate Monitoring One main advantage of the new ARC2 dataset is that it is readily applicable to oper ational climate monitoring. The daily availability of the ARC2 has allowed the generation of numerous operational products which provide important insight into the evolution of rainfall totals and anomalies at weekly, dekadal, monthly, and seasonal timesc ales, critical to decision making in agriculture, water resources, and food security. Many of these products are tailored to time scales that encompass agricultural cycles related to food security. It is here that the ARC2 has proved most useful to plan ning and emergency response. Figure 6 shows the operational ARC2 estimates, climate means and anomalies that were observed during the Southern Africa monsoon (Oct - May) season of 2008 - 2009. Based on the anomaly distribution and time series analyses, heavy precipitation accumulations over continental southwestern Africa (700 - 1000mm) resulted in an above - average (100 - 200% of normal) monsoon season over many parts of southern Angola, northern Namibia and the Caprivi Strip region. Meanwhile, many local areas along coastal southeastern Africa Figure 6a - c: Map of ARC2 total rainfall anomaly (mm), and observed and accumulative ARC2 rainfall time series of (b) Ondangwa, Nambia , and (c) Maputo, Mozambique for the southern Africa rains season from Oct 1, 2008 to May 31, 2009. experienced moderate rainfall deficits (100 - 300mm) for the season. The daily evolution of ARC2 rainfall in Ondangwa in northern Namibia from October of 2008 to May of 2009 depicted a normal start in their monsoon rains. However, the onset of an early season dry spell resulted in three consecutive weeks of no rainfall beginning from late December into mid - January. This dryness occurred when mo nsoon rains were expected to be at their maximum after crops had been planted for the season, and led to a rapid weakening of moisture surpluses. Following this dry spell, Ondangwa and much of northern Namibia observed the return of the rains but remained anomalously wet for five consecutive weeks ( Fig. 6b) . This heavy rainfall reportedly led to elevated water levels along the Okavango River Basin, resulting in numerous localized flooding events, displaced people, and damages to both crops and infrastructure in northern Namibia. The ARC2 was able to detect both the timing and severity of anomalous dry and wet spell events which had negatively impacted agricultural activities in the region. On the other side of the continent, time series analysis of ARC2 rainfall in Maputo, Mozambique also showed a normal start of the Oct - May monsoon (Fig. 6c ). However, intermittent and low rainfall totals since November led to large cumulative moisture deficits. Although southern Mozambique normally experiences less frequent rains compared to other areas further north, t he evolution of precipitation was considerably anomalous during the 2008 - 2009 season. Only 4 days of rain were observed over a three month period from February to April (a “rain day” defined as a day where rainfall was greater than or equal to 1mm). Acc ording to the ARC2, the total number of rain days for this period was tied for the lowest compared to all years from 1983 - 2010. Both the total seasonal rainfall anomaly and poor temporal distribution of rainfall was expected to impede the development of cr ops, and led to a reduction of agricultural yields in the region by the end of the season. Combined with the RFE2, GFS forecast data, and other weather and agricultural products; the daily ARC2 rainfall analyses are predominantly used to generate a weekl y regional hazards outlook for USAID / FEWS - NET. This weekly product outlines, discusses and illustrates important weather and climate phenomena which are likely to impact agricultural development in Africa. The regional hazard outlook is CPC’s main co ntribution to decision making in food security in collaboration with USAID / FEWS - NET. It is also distributed to a global list of users. 5. CONCLUSIONS This paper described a new, operational rainfall climatology from 1983 - present. Historical gauge and IR data were collected, and was reprocessed using the operational RFE2 algorithm at CPC. The ARC2 data is from 1983 - present, and is available on a daily basis. A comparison between the ARC1 and ARC2 data showed that the new ARC eliminated a large bias from 1998 - 2000 which significantly improved data quality and long - term stability. The improved consistency over an extended dataset record was the primary motivation for developing the ARC2 at CPC. Comparisons between the ARC2 and the GPCP, CMAP and PRE C/L long - term precipitation datasets showed that the mean spatial distribution, annual cycle, and inter - annual variability of rainfall in the ARC2 are quite consistent with the four datasets. However, ARC2 exhibits a summer dry bias that is believed to be associated with inconsistent GTS reports over the Gulf of Guinea region. A validation between the independent gauge and the ARC2, GPCP, CMAP and PREC/L products showed reasonable agreement with the GRID data, with a tendency to underestimate rainfall com pared to independent gauge observations. The historical evaluation of GTS input data over Africa showed that the daily reporting percentage of GTS gauges vary considerably from country to country, with the lowest reporting rates less than 30% found in cou ntries located in the Gulf of Guinea region. As such, the summer dry bias associated with the ARC2 is likely attributed to the decreased availability of in - situ measurements that regularly occur in this part of Africa. This is evidenced in two ways: (1) time series of both the RFE2 and the ARC1 dataset developed by (Love et. al., 2004) exhibit the same summer differences between the GPCP/CMAP datasets, and (2) the unavailability of daily GTS data appears to be a regular occurrence in the Gulf of Guinea re gion where summer monsoonal rainfall typically reaches its maximum. To reinforce this point, validation analyses yielded much better agreement with independent gauge data over areas where GTS reporting rates were significantly higher (i.e. Sahel), with m arginally more accurate estimates than GPCP and CMAP (analysis not shown). With GTS stations in the Sahel region reporting 80% more of the tine than the Gulf of Guinea region, this suggests that the availability of gauge data plays a pivotal role in the A RC2’s estimation capability, and likely explains why the ARC2 generally yields less rainfall estimates than GPCP/CMAP every summer from 1983 - present. From these validations, we conclude that the observed summer disagreements are inherently linked to the unavailability of GTS data on a real - time basis, which is not an issue for GPCP and CMAP due to the delay in their processing and the fact that they are monthly datasets. The value of the ARC2 is its availability in real time, convenient not only for cli mate studies but also for real time climate monitoring. A continuous, daily rainfall climatology at a high resolution will help users better understand the fine scale evolution and character of monsoonal precipitation over many remote regions of Africa. ARC2 can also be used to diagnose wet and dry spells, onset, peak and departure of seasonal precipitation across Africa. As evidenced in the case study over southern Africa’s monsoon season of 2008 - 2009, these attributes are important for improved decisio n making parameters in food security that monthly datasets cannot provide. ARC2 is already being used in the assessment of the impacts of rainfall anomalies on agriculture in Africa. It will continue to be a valuable tool for water requirement analyses for local scale crops, drought monitoring and other various socioeconomic indices. The extended record of the new ARC climatology provides nearly 30 years of daily precipitation estimates. Using consistent and reliable data as inputs for the ARC2 is esse ntial to the continuity and homogeneity of this long - term record. The simplicity of this process minimizes the possibility of introducing errors and/or other bias associated with new rainfall inputs moving forward. ARC2 will be of particular relevance an d importance in the context of understanding climate variability and change. 6. REFERENCES Adler R.F., Huffman G.J., Chang A., Ferraro F., Xie P., Janowiak J., Rudolf B., Schneider U., Curtis S., Bolvin D., Gruber A., Susskind J., Arkin P.A ., Nelkin E. 2003. The Version - 2 Global Precipitation Climatology Project (GPCP) monthly precipitation analysis (1979 - present). Journal of Hydrometeorology, 4 , 1147 - 1167. Arkin P.A., Meisner BN. 1987. The relationship between large - scale convective rainfall and cold cloud over the western hemisphere during 1982 - 84. Monthly Weather Review, 115 , 51 - 74. Arkin PA, Xie P. 1994. The Global Precipitation Climatology Project: First Algorithm Int ercomparison Project. Bulletin of the American Meteorological Society, 75 , 401 - 419. Chen M, Xie P, Janowiak J, Arkin PA. 2002. Global Land Precipitation: A 50 - year Analysis based on gauge observations. Journal of Hydrometeorology, 3 , 249 - 266. Chen M, Shi W, Xie P, Silva V, Kousky VE, Higgins WR, Janowiak J. 2008. Assessing objective techniques for gauge - based analysis of global daily precipitation. Journal of Geophysical Research, 113 , D04110. EUMETSAT, 2000. The Meteosat Archive: Fo rmat Guide No.1, Basic Imagery OpenMTP format. Revision 2.1 , Meteorological Archive and Retrieval Facility. Darmstadt, Germany. EUMETSAT, 2001. The Meteosat Archive: User Handbook 2.6. EUM TD 06 . Meteorological Archive and Retrieval Facility. Darmstadt, Germany. http://www.eumetsat.int/idcplg?IdcService=GET_FI LE&dDocName=PDF_TD06_MARF&RevisionSelec tionMethod=LatestReleased . EU METSAT, 2010. Personal Communication (In an email response to UMARF User Support). EUMETSAT, 2011: Meteosat First Generation Calibration Coefficients and Conversion Methods. http://www.eumetsat.int/Home/Main/DataProducts/ Calibration/MFGCalibration/index.htm?l=en Ferraro RR, Marks GF. 1995. The Development of SSM/I Rain Rate Retrieval Algorithms Using Ground Based Radar Measurements. Journal of A tmospheric and Oceanic Technology, 12 , 775 - 780 . Ferraro RR, Grody NC, Weng F, Basist A. 1996. An Eight - Year (1987 - 1994) Time Series of Rainfall, Clouds, Water Vapor, Snow Cover, and Sea Ice Derived from SSM/I Measurements. Bulletin of the American Meteo rological Society, 77 , 891 - 906. Joyce R, Arkin PA. 1997. Improving Estimates of Tropical and Subtropical Precipitation Using the GOES Precipitation Index. Journal of Atmospheric and Oceanic Technology, 14 , 997 - 1011. Love TB, Kumar V, Xie P, Thiaw W. 2004. A 20 - year daily Africa precipitation climatology using satellite and gauge data. Proceedings of the 84 th AMS Annual Meeting, P5.4. Conference on Applied Meteorology . 11 - 15 January 2004, Seattle, WA. Herman A, Kumar V, Arkin PA, Kousky JV. 1997. Objectively determined 10 - day African rainfall estimates created for famine early warning. International Journal of Remote Sensing, 18 , 2147 - 2159. Huffman GJ, Adler RF, Arkin PA, Chang A, Ferraro R, Gruber A, Janowiak J, McNab A, Rudolf B, Schneider U. 1997. The Global Precipitation Climatology Project (GPCP) combined precipitation dataset. Bulletin of the American Meteorological Society, 78 , 5 - 20. Huffman GJ, Adler RF, Bolvin DT, Guojun G, Nelkin EJ, Bowman KP, Hong Y, Stocker EF, Wolf DB. 2007. T he TRMM Mulisatellite Precipitation Analysis (TMPA): Quasi - Global, Multiyear, Combined - Sensor Precipitaiton Estimates at Fine Scales. Journal of Hydrometeorology, 8, 38 - 55. Huffman GJ, Bolvin DT. 2009. GPCP Version 2.1 Combined Precipitation Data Set Documentation. Laboratory for Atmospheres, NASA Goddard Space Flight Center and Science Systems and Applications, Inc. Shepard D. 1968. A two - dimensional interpolation function for irregularly s paced data. 23 rd National Conference of American Computing Machinery , Princeton, NJ. Reynolds RW. 1988. A real - time global sea surface temperature analysis. Journal of Climate, 1 , 75 - 86. Xie P, Arkin PA. 1995. An Intercomparison of Gauge Observations and Satellite Estimates of Monthly Precipitation. Journal of Applied Meteorology, 34, 1143 - 1160. Xie P, Arkin PA. 1996. Analyses of global monthly precipitation using gauge observations, satellite estimates, and numerical model predictions. Journal of Climate, 9 , 840 - 858. Xie P, Arkin PA. 1997. Global Precipitation: a 17 - year monthly analysis based on gauge observations, satellite estimates, and numerical model outputs. Bulletin of the American Meteorological Society, 78, 2537 - 2558. World Meteorolo gical Organization: Operational Information Service http://www.wmo.int/pages/prog/www/TEM/GTS/index_e n.html Zhao L, Ferraro R, Moore D. 2000. Validation of NOAA - 15 AMSU - A Rain Rate A lgorithms. 10 th Conference on Satellite Meteorology, 192 - 195