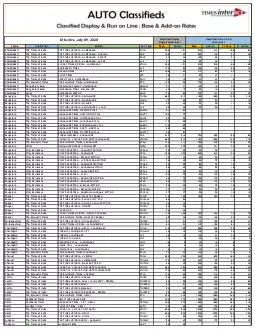
PDF-Chart 1: Bad Rates by characteristic for known population and true pop
Author : natalia-silvester | Published Date : 2016-07-21
2 3 Chart 2 Bad Rates by model rank for known population and true population One final gap is in the comparison between two models To make a judgment as to which
Presentation Embed Code
Download Presentation
Download Presentation The PPT/PDF document "Chart 1: Bad Rates by characteristic for..." is the property of its rightful owner. Permission is granted to download and print the materials on this website for personal, non-commercial use only, and to display it on your personal computer provided you do not modify the materials and that you retain all copyright notices contained in the materials. By downloading content from our website, you accept the terms of this agreement.
Chart 1: Bad Rates by characteristic for known population and true pop: Transcript
Download Rules Of Document
"Chart 1: Bad Rates by characteristic for known population and true pop"The content belongs to its owner. You may download and print it for personal use, without modification, and keep all copyright notices. By downloading, you agree to these terms.
Related Documents