/
POPULATION REFERENCE BUREAU POPULATION REFERENCE BUREAU

POPULATION REFERENCE BUREAU - PDF document

natalia-silvester
natalia-silvester . @natalia-silvester
Follow
468 views
Uploaded On 2016-11-13

POPULATION REFERENCE BUREAU - PPT Presentation

2015 World Population Data Sheet with a special focus on women146s empowerment 
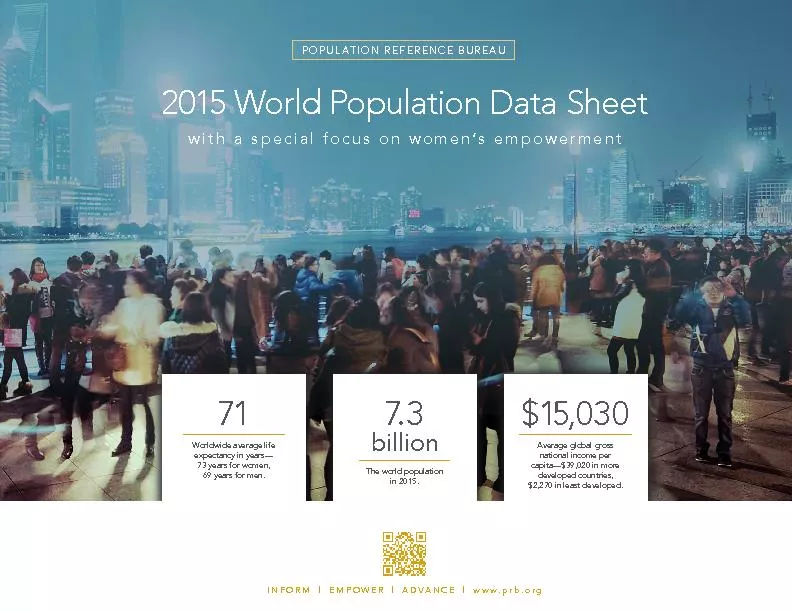
Worldwide average life expectancy in years151 73 15030Average global gross capita15139020 in more INFORM ID: 488409

2015 World Population Data Sheet

Share:

Link:

Embed:

Download Presentation from below link

Download Pdf The PPT/PDF document "POPULATION REFERENCE BUREAU" is the property of its rightful owner. Permission is granted to download and print the materials on this web site for personal, non-commercial use only, and to display it on your personal computer provided you do not modify the materials and that you retain all copyright notices contained in the materials. By downloading content from our website, you accept the terms of this agreement.


Presentation Transcript

POPULATION REFERENCE BUREAU 2015 World Population Data Sheet with a special focus on women’s empowerment Worldwide average life expectancy in years— 7.3 $15,030Average global gross capita—$39,020 in more INFORM | EMPOWER | ADVANCE | www.prb.org © 2015 Population Reference Bureau See notes on page 212015 WORLD POPULATION DATA SHEET NOTE: 2015 data refer to latest data available.MOST POPULOUS COUNTRIES,2015 AND 2050 COUNTRY, 2050POPULATION COUNTRY, 2015POPULATION COUNTRIESWITH THE HIGHEST AND LOWEST TOTAL FERTILITY RATES Congo, Dem. Rep. Korea, SouthTaiwanGreeceSingapore © 2015 Population Reference Bureau See notes on page 212015 WORLD POPULATION DATA SHEET POPULATION CLOCK,2015 MORE DEVELOPED LESS DEVELOPED 7,336,435,0001,254,199,0006,082,235,000Year145,973,00013,760,000132,213,000399,92637,700362,226278252Year57,052,00012,283,00044,769,000156,30633,652122,654109Natural increase perYear88,921,0001,477,00087,444,000243,6204,047239,573169166Year5,351,00073,0005,278,00014,660 201 14,459 10 0.1 10 © 2015 Population Reference Bureau 2015 WORLD POPULATION DATA SHEET The authors gratefully acknowledge the valuable assistance of PRB senior consultant, Carl Haub; PRB staff members John May, Kelvin Pollard, Donna Clifton, Carolyn Lamere, Heather Randall, and Nicole LaGrone; PRB interns Heather Zaccaro, Adaeze Ezeofor, and Kimberly Rightor; and staff of the International Programs Center of the U.S. Census Bureau; the United Nations (UN) Population Division; and the Institut national d’etudes démographiques (INED), Paris, in the preparation of this year’s World Population Data Sheet.This publication is funded by the William and Flora Hewlett Foundation, the David and Lucile Packard Foundation, the U.S. Agency for Interna-tional Development (IDEA Project, No. AID-0AA-A-10-00009), and supporters. The contents are the responsibility of the Population Reference Bureau and do not necessarily re ect the views of USAID or the United States government.The Data Sheet lists all geopolitical entities with populations of 150,000 or more and all mem-bers of the UN. These include sovereign states, dependencies, overseas departments, and some territories whose status or boundaries may be undetermined or in dispute. More developedregions, following the UN classi cation, comprise all of Europe and North America, plus Australia, Japan, and New Zealand. All other regions and countries are classi ed as less developed. The least developed countries consist of 48 coun-tries with especially low incomes, high economic vulnerability, and poor human development indi-cators; 34 of these countries are in sub-Saharan Africa, 13 in Asia, and one in the Caribbean. The criteria and list of countries, as de ned by the UN, can be found at http://unohrlls.org/about-ldcs/.Sub-Saharan Africa: All countries of Africa except the northern African countries of Algeria, Egypt, Libya, Morocco, Sudan, Tunisia, and Western Sahara.World and Regional Totals: Regional population totals are independently rounded and include small countries or areas not shown. Regional and world rates and percentages are weighted averages of countries for which data are available. For most indicators, regional averages are shown when data or estimates are available for at least three-quarters of the region’s population. ForSecondary School Enrollment Ratios, HIV Prevalence Rates, and Female Share of Nonagricultural Wage Earn-ers, regional averages are shown when data or estimates are available for at least half of the region’s population.World Population Data Sheets from different years should not be used as a time seriesFluctuations in values from year to year often re ect revisions based on new data or estimates rather than actual changes in levels. Additional information on likely trends and consistent time series can be obtained from PRB, and are also available from UN and U.S. Census Bureau publi-cations and websites.The rates and  gures are primarily compiled from the following sources: of cial country statistical yearbooks, bulletins, and websites; the UN Demographic Yearbook, 2013; and Population and Vital Statistics Report of the UN Statistics Division; World Population Prospects: The 2015 Revision of the UN Population Division; and the International Data Base of the International Programs Center, U.S. Census Bureau. Other sources include recent demographic surveys such as the Demographic and Health Surveys, Multiple Indicator Cluster Surveys, special studies, and direct communication with demographers and statistical bureaus in the United States and abroad. Speci c data sources may be obtained by contacting the authors of the 2015 World Population Data Sheet. For countries with complete registration of births and deaths, rates are those most recently reported. For more developed countries, nearly all vital rates refer to 2014 or 2013.Mid-2015 PopulationEstimates are based on a recent census, of cial national data, or PRB, UN, and U.S. Census Bureau projections. The effects of refugee movements, large numbers of foreign workers, and population shifts due to contemporary political events are taken into account to the extent possible.Birth and Death RateThe annual number of births and deaths per 1,000 total population. These rates are often referred to as “crude rates” since they do not take a population’s age structure into account. Thus, crude death rates in more developed countries with a relatively large proportion of high-mortality older population are often higher than those in less developed countries with lower life expectancy.Net MigrationThe estimated rate of net immigration (immigration minus emigration) per 1,000 population for a recent year based upon the of cial national rate or derived as a residual from estimated birth, death, and population growth rates. Migration rates can vary substantially from year to year for any particular country, as can the de nition of an immigrant.Projected Population, 2030 and 2050Projected populations based on reasonable assumptions on the future course of fertility, mortality, and migration. Projections are based on of cial country projections, series issued by the UN or the U.S. Census Bureau, or PRB projections.Infant Mortality RateThe annual number of deaths of infants under age 1 per 1,000 live births. Rates shown with decimals indicate national statistics reported as completely registered, while those without are estimates from the sources cited above. Rates shown in italics are based upon fewer than 50 annual infant deaths and, as a result, are subject to considerable yearly variability; rates shown for such countries are averages for a multiple-year period. Total Fertility Rate (TFR)The average number of children a woman would have assuming that current age-speci c birth rates remain constant throughout her childbearing years (usually considered to be ages 15 to 49).Population Under Age 15/Age 65+The percentage of the total population in those ages, which are often considered the “dependent ages.” GNI PPP per Capita, 2014 (US$)GNI PPP per capita is gross national income in purchasing power parity (PPP) divided by mid-year population. GNI PPP refers to gross national income converted to “international” dollars using a purchasing power parity conversion factor. PPP adjusts exchange rates to relative purchasing power in different countries, providing a more ac-curate basis of comparison for GNI. Data are from the World Bank. Figures in italics are for 2013, 2012, or 2011.Percent UrbanPercentage of the total population living in areas termed “urban” by that country or by the UN. Countries de ne urban in many different ways, from population centers of 100 or more dwellings to only the population living in national and provincial capitals.Population per Square Kilometer of Arable LandThe mid-year 2015 population divided by the square kilometers of arable land. Arable land is de ned by the UN Food and Agriculture Organization (FAO) to include “the land under temporary agricultural crops (multiple-cropped areas are counted only once), temporary meadows for mowing or pasture, land under market and kitchen gardens and land temporarily fallow (less than  ve years).” Data for the percent of land that is arable and the square kilometers in a country are from the FAO.Contraceptive UseThe percentage of currently married or “in union” women of reproductive age who are currently using any form of contraception. Modern methods include clinic and supply methods such as the pill, IUD, condom, and sterilization. Data are from the most recently available national-level surveys, such as Demographic and Health Surveys, Reproductive Health Surveys, Multiple Indicator Cluster Surveys, regional survey programs, national surveys, and the UN Population Division World Contraceptive Use 2014. Data prior to 2009 are shown in italics.Life Expectancy at BirthThe average number of years a newborn infant can expect to live under current mortality rates. Maternal Deaths per 100,000 Births Maternal deaths in a time period divided by the number of live births in the same period, expressed per 100,000 live births. A maternal death is de ned by the World Health Organization (WHO) as “the death of a woman while pregnant or within 42 days of the termination of pregnancy, irrespective of the duration and site of the pregnancy, from any cause to or aggravated by the pregnancy or its management but not from accidental or incidental causes.” Data are from the 2014 report Trends in Maternal Mortality: 1990 to 2013 that compiles estimates by WHO, UNICEF, UNFPA, the World Bank, and the UN Population Division. HIV Prevalence The proportion of the population living with HIV regardless of the time of infection, knowledge of the infection, or stage of the disease. Data are from UNAIDS.Secondary School Enrollment RatioThe number of students enrolled in secondary education divided by the secondary-school-age population (Gross Enrollment Ratio). The ratio can be over 100 when there are students enrolled who are older or younger than the age expected for secondary school students. Data are from UNESCO for 2008-2014. Tertiary School Gender Parity IndexThe tertiary education gross enrollment ratio for women divided by the tertiary gross enrollment ratio for men. An index less than one indicates that men are more represented in higher education than women, while an index greater than one indicates that women are more represented. Data are from UNESCO for 2008-2014.Gender Ratio of Labor Force Participation RatesThe ratio of the female labor force participation rate over the male rate. The labor force participation rate is de ned as the proportion of the population ages 15 years and older who are economically active, including those employed and unemployed. A ratio less than one indicates that the male labor force participation rate is greater than the female rate while a ratio of more than one indicates that the female rate is greater than the male rate. Data are from the World Bank for 2013. Female Share of Nonagricultural Wage EarnersThe percent of workers in wage employment in the nonagricultural sector who are women. In a small number of countries the de nition of the sector is one of the following: the economically active population in nonagriculture, total employment, total employment in nonagriculture, total paid employment, and employment in the public sector. Data are from the UN from 2008-2013. Female Share of Parliament MembersThe percentage of seats in a country’s single chamber, combined higher and lower chambers of the national parliament, or other national legislature held by women. Data are from the Inter-Parliamentary Union from May 1, 2015. Acknowledgments, Notes, Sources, and De nitionsPOPULATION REFERENCE BUREAU people around the world about population, health, and the environment, and them to the well-being of current and future generations.1875 Connecticut Ave., NW, Suite 520, Washington, DC 20009 USAtel. 202-483-1100 • fax 202-328-3937 • e-mail: popref@prb.org • website: www.prb.org If you value PRB’s World Population Data Sheet and are among the tens of thousands of people who eagerly anticipate its publication each year, please consider making a contribution to PRB. Your donation will help ensure that PRB can maintain its commitment to keeping the as affordable as possible. Visit our website to donate now: www.prb.org.research to provide the most objective, accurate, that are easily understood by advocates, journalists, and decisionmakers alike.INNOVATIVE TOOLS.PRB creates interactive content to make data and research more how projections of U.S. child poverty and the viewer. INFLUENTIAL PUBLICATIONS.looks at gaps in key development indicators between urban and rural dwellers in many low- and middle-income countries. MULTIMEDIA.PRB has produced hundreds of cutting-edge video and audio presentations PRB’s website provides access to all of our content, including our respected Data Sheets, visualizations, and data and analysis on world issues ranging from gender to aging to family PRB empowers people—researchers, journalists, policymakers, and educators—to use information about population, health, and the environment to encourage action. Frequently, people have information but lack the skills and tools needed to communicate effectively to decisionmakers. PRB builds coalitions and conducts trainings to share techniques to inform policy. PRB strengthens the capacity of journalists from developing countries through seminars and study tours. We organized several study tours for journalists in to visit projects and the people they affect.POLICY COMMUNICATION TRAINING.In the past  ve years, PRB has trained more than 1,000 professionals in Asia, Africa, and Latin America to communicate data and research effectively. Each year, for example, we have sponsored two workshops with Kenya’s National Council for Population and Development, training local and regional policymakers, program managers, and advocates. PRB developed and coordinates the American Community Survey (ACS) Data Users Group to increase understanding of the value and utility of ACS data and to facilitate key ACS data issues and applications. This group connects ACS data users and helps them share information and materials through an online community forum, webinars, special sessions at professional meetings, and an annual conference.ADVANCEPRB works to ensure that policymakers worldwide rely on sound evidence, rather than anecdotal or and environmental policies. While the numbers of publications created or workshops conducted are one way to measure PRB’s work, the adoption of evidence-based policies, increased demand for health services, and active coalitions are better gauges of progress toward positive social change. PRB provides analysis for the KIDS COUNT Data Book, an annual report card on the well-being of children and families in the United States. The Data Book has helped promote the passage of several U.S. policies, including the State Children’s Health Insurance Program. DEMAND FOR HEALTH SERVICES.TV reporting in India by an alumna of PRB’s Women’s Edition training program led to the creation of health camps to care for pregnant women in the slums. Another led to the renewal of a family planning program that promoted birth spacing. East Africa Population, Health, and Environment Network to increase information sharing across the region. In the Lake Victoria Basin, PRB also provides technical assistance on integrated population, health, and environment development in the region. PRB’s 2015 World Population Data Sheetis available in English, French, and Spanish at www.prb.org. Also online:A customized Data Dashboard where users can view multiple indicators for regions or countries.A video focusing on what the data say about the state of women’s empowerment. An interactive world map illustrating key demographic variables by country and region.To order PRB publications (discounts available for bulk orders):Online at www.prb.org.E-mail: popref@prb.org.Call toll-free: 800-877-9881.Fax: 202-328-3937.Mail: 1875 Connecticut Ave., NW, Suite 520, Washington, DC 20009.Data prepared by PRB demographers Toshiko Kaneda and Kristin Bietsch.© August 2015. Population Reference Bureau.All rights reserved. ISSN 0085-8315Photo credit, cover: © Jörg Dickmann, goZOOMA WomenWomenWomenWomenWomenWomenshow percent in 2011show percent in 2014 Financial Inclusion of Women ExpandsFinancial inclusion—making appropriate, affordable, and convenient  nancial services available to all people—is a global development priority. For women, access to savings, credit, and other services can help them gain more  nancial independence, better manage and leverage their resources, and build capital to support income-generating activities. A core measure of  nancial inclusion is whether an individual uses an account at a bank or other formal  nancial institution. In most countries, even many least developed ones, the share of women with such accounts has increased over the past few years. Gaps remain between men and women, but these have narrowed in many cases, and most developed countries show effective gender parity at high levels of usage. Rapid expansion of mobile money and other  nancial services available via mobile devices, particularly in Africa, provide a convenient way for both men and women to access such services. Women are currently using mobile more than other formal accounts in several African countries (see table).Source: World Bank, Global Findex Database. WORLD POPULATION HIGHLIGHTSFOCUS ON WOMEN’S EMPOWERMENT Large Purchases Jordan 010203070100172018151832274753665737426574667583748488917177896479725617 KenyaEgyptPhilippinesPakistanJordanSenegalNigeria 20142010 2006 2002 1998 1994 1990 6441587140362113314313524780 Women 25-29Women 25+ Rates of Early Marriage Fall, Particularly Among Those Under 15 Early marriage (before age 18) undermines the rights and livelihood opportunities of adolescent girls by leaving them vulnerable to the health risks of early pregnancy and childbearing, and prematurely ending their schooling. Rates of early marriage have declined broadly in the past 20 years, particularly among girls who are under age 15. Part of the overall decline re ects improvements in girls’ access to education: As girls educational attainment improves, the proportion marrying early tends to fall. Better employment opportunities for women and girls arriage among rural migrants under age 15. The percentage of Bangladeshi girls married by age 18 has declined much more slowly as the youngest potential brides tend to postpone marriage by only a few years. The majority of Bangladeshi girls continue to marry before age 18. Women Post Uneven Gains in Household Decisionmaking PowerMarried women in many countries are increasingly likely to have a say in household decisions, but these gains do not necessarily apply to every type of decision. When women are included in decisions about household spending, more money tends to be spent for the bene t of women and children. And when women are able to make decisions about their health care, they are less vulnerable to preventable diseases. Progress in these areas has varied by country, and even in countries showing notable gains, many women still do not engage in all types of important decisions. For example, in Nepal, only 66 percent of women have a say about their own health care decisions. The same percentage of Zambian women have the opportunity to make decisions about large household purchases.Family Planning Needs Increasingly Met by Modern Methods, but More Progress Needed “Demand for family planning satis ed with modern methods” has emerged as a key indicator of contraceptive availability and use. The indicator measures the proportion of women who want to delay or limit childbearing and who are using modern methods of contraception. Family planning experts have urged countries to strive for meeting at least 75 percent of demand with modern methods. Over the past two decades, a signi cant number of less developed countries have seen increases in the share of demand satis ed with modern methods, but many countries remain far below the proposed 75 percent benchmark. They will need to accelerate progress over the coming decade so that increased contraceptive use can translate into improved maternal and child health, slower population growth, increased economic well-being, and environmental sustainability.U.S. Gender Gap in College Completion Eases; Earnings Gap Persists Educational attainment in the United States has risen substantially over the last four decades. Between 1970 and 2014, the share of men ages 25 and older with at least a college degree climbed from 14 percent to 32 percent, while the share of adult women with at least a college degree quadrupled from 8 percent to 32 percent. For ages 25 to 29 only, the share of women with a bachelor’s degree or higher actually started outpacing the share for men in 1991. But women still lag behind men in earnings. Among full-time, year-round workers ages 25 and older in 2013, women’s median earnings were about 79 percent of men’s, up from 71 percent in 1993 (see table). This gender earnings gap persists across all educational levels. For bachelor’s degree holders, one factor may be that women are less likely to get degrees in higher-earning  elds such as science and engineering. In 2013, among adults ages 25 and older with a bachelor’s degree, only 26 percent of women had a degree in science and engineering, compared with 44 percent of men. However, even among full-time, year-round workers with engineering degrees, women’s median earnings in 2011 were only 83 percent of men’s. Data points are for each corresponding survey year.Source: ICF International, Demographic and Health Surveys. Source: ICF International, Demographic and Health Surveys. Source: International, Demographic and Health Surveys.Source: Census Bureau: 1970 to 2002 March Current Population Survey; 2003 to 2014 Annual Social and Economic Supplement to the Current Population Survey; American Community Survey Brief 11-10 (Oct. 2012); and PRB analysis of data from the 2013 American Community Survey. Percent of Young Women Married by Age 15 (numbers in white) and Age 18 (numbers in black) Percent of Demand for Family Planning Satis ed by Modern Contraceptive MethodsPercent Who Have Completed College, by AgePercent of Currently Married Women Who Have a Say in Decisions About This TopicPercent Who Have Used an Account at a Formal Financial Institution 837673654941271718192021991–19922141992201120002011199–199420121992PeruEgyptEthiopiaBangladeshNiger4728472919167 2 3 3 Percent of Women Using Financial Services by Type, 2014 Mobile Financial Other Formal Financial Institution te d'Ivoire Tanzania Female-to-Male Median Earnings Ratio Among Full-Time Year-Round Workers1993High School Some College, No DegreeBachelor’s Degree Bachelor’s Degree or MoreRatios are expressed as a percent.Percent Who Agree That Husband Is Justi ed Beating Wife if She Leaves the House Without Informing HimAcceptance of Wife Beating Recedes Violence against women poses a serious challenge to women’s empowerment. Combating such violence often requires changing the attitudes and beliefs of both men and women. In fact, in some countries, substantial percentages of women actually agree that a husband has the right to beat a wife under certain circumstances. Many of these women believe a husband is justi ed in hitting a wife ries. For example, in 2013, 13 percent of Nigerian men and 25 percent of Nigerian women viewed a wife leaving home without telling the husband as justi cation for wife beating, down from 19 percent and 32 percent, respectively, in 2008. Zambia also showed notable drops for both men and women between 2007 and 2013-2014. Globally, however, there is still a long path to achieve zero global tolerance of this harmful practice. Source: ICF International, Demographic and Health Surveys. Women MOST POPULOUS COUNTRIES,2015 AND 2050COUNTRY, 2050POPULATION COUNTRY, 2015POPULATION COUNTRIESWITH THE HIGHEST AND LOWEST TOTAL FERTILITY RATESCongo, Dem. Rep. POPULATION CLOCK,2015MORE DEVELOPED LESS DEVELOPED 7,336,435,0001,254,199,0006,082,235,000Year145,973,00013,760,000132,213,000399,92637,700362,226278252Year57,052,00012,283,00044,769,000156,30633,652122,65410923Natural increase perYear88,921,0001,477,00087,444,000243,6204,047239,573169166Year5,351,00073,0005,278,00014,660 201 14,459 10 0.1 10 Korea, SouthTaiwanGreeceSingapore Worldwide average life expectancy in years—7.3$15,030Average global gross capita—$39,020 in more INFORM | EMPOWER | ADVANCE | www.prb.org POPULATION REFERENCE BUREAU2015 World Population Data Sheet with a special focus on women’s empowerment © 2015 Population Reference Bureau 2015 WORLD POPULATION DATA SHEET The authors gratefully acknowledge the valuable assistance of PRB senior consultant, Carl Haub; PRB staff members John May, Kelvin Pollard, Donna Clifton, Carolyn Lamere, Heather Randall, and Nicole LaGrone; PRB interns Heather Zaccaro, Adaeze Ezeofor, and Kimberly Rightor; and staff of the International Programs Center of the U.S. Census Bureau; the United Nations (UN) Population Division; and the Institut national d’etudes démographiques (INED), Paris, in the preparation of this year’s World Population Data Sheet.This publication is funded by the William and Flora Hewlett Foundation, the David and Lucile Packard Foundation, the U.S. Agency for Interna-tional Development (IDEA Project, No. AID-0AA-A-10-00009), and supporters. The contents are the responsibility of the Population Reference Bureau and do not necessarily re ect the views of USAID or the United States government.The Data Sheet lists all geopolitical entities with populations of 150,000 or more and all mem-bers of the UN. These include sovereign states, dependencies, overseas departments, and some territories whose status or boundaries may be undetermined or in dispute. More developedregions, following the UN classi cation, comprise all of Europe and North America, plus Australia, Japan, and New Zealand. All other regions and countries are classi ed as less developed. The least developed countries consist of 48 coun-tries with especially low incomes, high economic vulnerability, and poor human development indi-cators; 34 of these countries are in sub-Saharan Africa, 13 in Asia, and one in the Caribbean. The criteria and list of countries, as de ned by the UN, can be found at http://unohrlls.org/about-ldcs/.Sub-Saharan Africa: All countries of Africa except the northern African countries of Algeria, Egypt, Libya, Morocco, Sudan, Tunisia, and Western Sahara.World and Regional Totals: Regional population totals are independently rounded and include small countries or areas not shown. Regional and world rates and percentages are weighted averages of countries for which data are available. For most indicators, regional averages are shown when data or estimates are available for at least three-quarters of the region’s population. ForSecondary School Enrollment Ratios, HIV Prevalence Rates, and Female Share of Nonagricultural Wage Earn-ers, regional averages are shown when data or estimates are available for at least half of the region’s population.World Population Data Sheets from different years should not be used as a time seriesFluctuations in values from year to year often re ect revisions based on new data or estimates rather than actual changes in levels. Additional information on likely trends and consistent time series can be obtained from PRB, and are also available from UN and U.S. Census Bureau publi-cations and websites.The rates and  gures are primarily compiled from the following sources: of cial country statistical yearbooks, bulletins, and websites; the UN Demographic Yearbook, 2013; and Population and Vital Statistics Report of the UN Statistics Division; World Population Prospects: The 2015 Revision of the UN Population Division; and the International Data Base of the International Programs Center, U.S. Census Bureau. Other sources include recent demographic surveys such as the Demographic and Health Surveys, Multiple Indicator Cluster Surveys, special studies, and direct communication with demographers and statistical bureaus in the United States and abroad. Speci c data sources may be obtained by contacting the authors of the 2015 World Population Data Sheet. For countries with complete registration of births and deaths, rates are those most recently reported. For more developed countries, nearly all vital rates refer to 2014 or 2013.Mid-2015 PopulationEstimates are based on a recent census, of cial national data, or PRB, UN, and U.S. Census Bureau projections. The effects of refugee movements, large numbers of foreign workers, and population shifts due to contemporary political events are taken into account to the extent possible.Birth and Death RateThe annual number of births and deaths per 1,000 total population. These rates are often referred to as “crude rates” since they do not take a population’s age structure into account. Thus, crude death rates in more developed countries with a relatively large proportion of high-mortality older population are often higher than those in less developed countries with lower life expectancy.Net MigrationThe estimated rate of net immigration (immigration minus emigration) per 1,000 population for a recent year based upon the of cial national rate or derived as a residual from estimated birth, death, and population growth rates. Migration rates can vary substantially from year to year for any particular country, as can the de nition of an immigrant.Projected Population, 2030 and 2050Projected populations based on reasonable assumptions on the future course of fertility, mortality, and migration. Projections are based on of cial country projections, series issued by the UN or the U.S. Census Bureau, or PRB projections.Infant Mortality RateThe annual number of deaths of infants under age 1 per 1,000 live births. Rates shown with decimals indicate national statistics reported as completely registered, while those without are estimates from the sources cited above. Rates shown in italics are based upon fewer than 50 annual infant deaths and, as a result, are subject to considerable yearly variability; rates shown for such countries are averages for a multiple-year period. Total Fertility Rate (TFR)The average number of children a woman would have assuming that current age-speci c birth rates remain constant throughout her childbearing years (usually considered to be ages 15 to 49).Population Under Age 15/Age 65+The percentage of the total population in those ages, which are often considered the “dependent ages.” GNI PPP per Capita, 2014 (US$)GNI PPP per capita is gross national income in purchasing power parity (PPP) divided by mid-year population. GNI PPP refers to gross national income converted to “international” dollars using a purchasing power parity conversion factor. PPP adjusts exchange rates to relative purchasing power in different countries, providing a more ac-curate basis of comparison for GNI. Data are from the World Bank. Figures in italics are for 2013, 2012, or 2011.Percent UrbanPercentage of the total population living in areas termed “urban” by that country or by the UN. Countries de ne urban in many different ways, from population centers of 100 or more dwellings to only the population living in national and provincial capitals.Population per Square Kilometer of Arable LandThe mid-year 2015 population divided by the square kilometers of arable land. Arable land is de ned by the UN Food and Agriculture Organization (FAO) to include “the land under temporary agricultural crops (multiple-cropped areas are counted only once), temporary meadows for mowing or pasture, land under market and kitchen gardens and land temporarily fallow (less than  ve years).” Data for the percent of land that is arable and the square kilometers in a country are from the FAO.Contraceptive UseThe percentage of currently married or “in union” women of reproductive age who are currently using any form of contraception. Modern methods include clinic and supply methods such as the pill, IUD, condom, and sterilization. Data are from the most recently available national-level surveys, such as Demographic and Health Surveys, Reproductive Health Surveys, Multiple Indicator Cluster Surveys, regional survey programs, national surveys, and the UN Population Division World Contraceptive Use 2014. Data prior to 2009 are shown in italics.Life Expectancy at BirthThe average number of years a newborn infant can expect to live under current mortality rates. Maternal Deaths per 100,000 Births Maternal deaths in a time period divided by the number of live births in the same period, expressed per 100,000 live births. A maternal death is de ned by the World Health Organization (WHO) as “the death of a woman while pregnant or within 42 days of the termination of pregnancy, irrespective of the duration and site of the pregnancy, from any cause to or aggravated by the pregnancy or its management but not from accidental or incidental causes.” Data are from the 2014 report Trends in Maternal Mortality: 1990 to 2013 that compiles estimates by WHO, UNICEF, UNFPA, the World Bank, and the UN Population Division. HIV Prevalence The proportion of the population living with HIV regardless of the time of infection, knowledge of the infection, or stage of the disease. Data are from UNAIDS.Secondary School Enrollment RatioThe number of students enrolled in secondary education divided by the secondary-school-age population (Gross Enrollment Ratio). The ratio can be over 100 when there are students enrolled who are older or younger than the age expected for secondary school students. Data are from UNESCO for 2008-2014. Tertiary School Gender Parity IndexThe tertiary education gross enrollment ratio for women divided by the tertiary gross enrollment ratio for men. An index less than one indicates that men are more represented in higher education than women, while an index greater than one indicates that women are more represented. Data are from UNESCO for 2008-2014.Gender Ratio of Labor Force Participation RatesThe ratio of the female labor force participation rate over the male rate. The labor force participation rate is de ned as the proportion of the population ages 15 years and older who are economically active, including those employed and unemployed. A ratio less than one indicates that the male labor force participation rate is greater than the female rate while a ratio of more than one indicates that the female rate is greater than the male rate. Data are from the World Bank for 2013. Female Share of Nonagricultural Wage EarnersThe percent of workers in wage employment in the nonagricultural sector who are women. In a small number of countries the de nition of the sector is one of the following: the economically active population in nonagriculture, total employment, total employment in nonagriculture, total paid employment, and employment in the public sector. Data are from the UN from 2008-2013. Female Share of Parliament MembersThe percentage of seats in a country’s single chamber, combined higher and lower chambers of the national parliament, or other national legislature held by women. Data are from the Inter-Parliamentary Union from May 1, 2015. Acknowledgments, Notes, Sources, and De nitionsPOPULATION REFERENCE BUREAU people around the world about population, health, and the environment, and them to the well-being of current and future generations.1875 Connecticut Ave., NW, Suite 520, Washington, DC 20009 USAtel. 202-483-1100 • fax 202-328-3937 • e-mail: popref@prb.org • website: www.prb.org If you value PRB’s World Population Data Sheet and are among the tens of thousands of people who eagerly anticipate its publication each year, please consider making a contribution to PRB. Your donation will help ensure that PRB can maintain its commitment to keeping the as affordable as possible. Visit our website to donate now: www.prb.org.research to provide the most objective, accurate, that are easily understood by advocates, journalists, and decisionmakers alike.INNOVATIVE TOOLS.PRB creates interactive content to make data and research more how projections of U.S. child poverty and the viewer. INFLUENTIAL PUBLICATIONS.looks at gaps in key development indicators between urban and rural dwellers in many low- and middle-income countries. MULTIMEDIA.PRB has produced hundreds of cutting-edge video and audio presentations PRB’s website provides access to all of our content, including our respected Data Sheets, visualizations, and data and analysis on world issues ranging from gender to aging to family PRB empowers people—researchers, journalists, policymakers, and educators—to use information about population, health, and the environment to encourage action. Frequently, people have information but lack the skills and tools needed to communicate effectively to decisionmakers. PRB builds coalitions and conducts trainings to share techniques to inform policy. PRB strengthens the capacity of journalists from developing countries through seminars and study tours. We organized several study tours for journalists in to visit projects and the people they affect.POLICY COMMUNICATION TRAINING.In the past  ve years, PRB has trained more than 1,000 professionals in Asia, Africa, and Latin America to communicate data and research effectively. Each year, for example, we have sponsored two workshops with Kenya’s National Council for Population and Development, training local and regional policymakers, program managers, and advocates. PRB developed and coordinates the American Community Survey (ACS) Data Users Group to increase understanding of the value and utility of ACS data and to facilitate key ACS data issues and applications. This group connects ACS data users and helps them share information and materials through an online community forum, webinars, special sessions at professional meetings, and an annual conference.ADVANCEPRB works to ensure that policymakers worldwide rely on sound evidence, rather than anecdotal or and environmental policies. While the numbers of publications created or workshops conducted are one way to measure PRB’s work, the adoption of evidence-based policies, increased demand for health services, and active coalitions are better gauges of progress toward positive social change. PRB provides analysis for the KIDS COUNT Data Book, an annual report card on the well-being of children and families in the United States. The Data Book has helped promote the passage of several U.S. policies, including the State Children’s Health Insurance Program. DEMAND FOR HEALTH SERVICES.TV reporting in India by an alumna of PRB’s Women’s Edition training program led to the creation of health camps to care for pregnant women in the slums. Another led to the renewal of a family planning program that promoted birth spacing. East Africa Population, Health, and Environment Network to increase information sharing across the region. In the Lake Victoria Basin, PRB also provides technical assistance on integrated population, health, and environment development in the region. PRB’s 2015 World Population Data Sheetis available in English, French, and Spanish at www.prb.org. Also online:A customized Data Dashboard where users can view multiple indicators for regions or countries.A video focusing on what the data say about the state of women’s empowerment. An interactive world map illustrating key demographic variables by country and region.To order PRB publications (discounts available for bulk orders):Online at www.prb.org.E-mail: popref@prb.org.Call toll-free: 800-877-9881.Fax: 202-328-3937.Mail: 1875 Connecticut Ave., NW, Suite 520, Washington, DC 20009.Data prepared by PRB demographers Toshiko Kaneda and Kristin Bietsch.© August 2015. Population Reference Bureau.All rights reserved. ISSN 0085-8315Photo credit, cover: © Jörg Dickmann, goZOOMA WomenWomenWomenWomenWomenWomenshow percent in 2011show percent in 2014 Financial Inclusion of Women ExpandsFinancial inclusion—making appropriate, affordable, and convenient  nancial services available to all people—is a global development priority. For women, access to savings, credit, and other services can help them gain more  nancial independence, better manage and leverage their resources, and build capital to support income-generating activities. A core measure of  nancial inclusion is whether an individual uses an account at a bank or other formal  nancial institution. In most countries, even many least developed ones, the share of women with such accounts has increased over the past few years. Gaps remain between men and women, but these have narrowed in many cases, and most developed countries show effective gender parity at high levels of usage. Rapid expansion of mobile money and other  nancial services available via mobile devices, particularly in Africa, provide a convenient way for both men and women to access such services. Women are currently using mobile more than other formal accounts in several African countries (see table).Source: World Bank, Global Findex Database. WORLD POPULATION HIGHLIGHTSFOCUS ON WOMEN’S EMPOWERMENT Large Purchases Jordan 010203070 100 172018151832274753665737426574667583748488917177896479725617 KenyaEgyptPhilippinesPakistanJordanSenegalNigeria 20142010 2006 2002 1998 1994 1990 6441587140362113314313524780 Women 25-29Women 25+ Rates of Early Marriage Fall, Particularly Among Those Under 15 Early marriage (before age 18) undermines the rights and livelihood opportunities of adolescent girls by leaving them vulnerable to the health risks of early pregnancy and childbearing, and prematurely ending their schooling. Rates of early marriage have declined broadly in the past 20 years, particularly among girls who are under age 15. Part of the overall decline re ects improvements in girls’ access to education: As girls educational attainment improves, the proportion marrying early tends to fall. Better employment opportunities for women and girls arriage among rural migrants under age 15. The percentage of Bangladeshi girls married by age 18 has declined much more slowly as the youngest potential brides tend to postpone marriage by only a few years. The majority of Bangladeshi girls continue to marry before age 18. Women Post Uneven Gains in Household Decisionmaking PowerMarried women in many countries are increasingly likely to have a say in household decisions, but these gains do not necessarily apply to every type of decision. When women are included in decisions about household spending, more money tends to be spent for the bene t of women and children. And when women are able to make decisions about their health care, they are less vulnerable to preventable diseases. Progress in these areas has varied by country, and even in countries showing notable gains, many women still do not engage in all types of important decisions. For example, in Nepal, only 66 percent of women have a say about their own health care decisions. The same percentage of Zambian women have the opportunity to make decisions about large household purchases. Family Planning Needs Increasingly Met by Modern Methods, but More Progress Needed “Demand for family planning satis ed with modern methods” has emerged as a key indicator of contraceptive availability and use. The indicator measures the proportion of women who want to delay or limit childbearing and who are using modern methods of contraception. Family planning experts have urged countries to strive for meeting at least 75 percent of demand with modern methods. Over the past two decades, a signi cant number of less developed countries have seen increases in the share of demand satis ed with modern methods, but many countries remain far below the proposed 75 percent benchmark. They will need to accelerate progress over the coming decade so that increased contraceptive use can translate into improved maternal and child health, slower population growth, increased economic well-being, and environmental sustainability.U.S. Gender Gap in College Completion Eases; Earnings Gap Persists Educational attainment in the United States has risen substantially over the last four decades. Between 1970 and 2014, the share of men ages 25 and older with at least a college degree climbed from 14 percent to 32 percent, while the share of adult women with at least a college degree quadrupled from 8 percent to 32 percent. For ages 25 to 29 only, the share of women with a bachelor’s degree or higher actually started outpacing the share for men in 1991. But women still lag behind men in earnings. Among full-time, year-round workers ages 25 and older in 2013, women’s median earnings were about 79 percent of men’s, up from 71 percent in 1993 (see table). This gender earnings gap persists across all educational levels. For bachelor’s degree holders, one factor may be that women are less likely to get degrees in higher-earning  elds such as science and engineering. In 2013, among adults ages 25 and older with a bachelor’s degree, only 26 percent of women had a degree in science and engineering, compared with 44 percent of men. However, even among full-time, year-round workers with engineering degrees, women’s median earnings in 2011 were only 83 percent of men’s. Data points are for each corresponding survey year.Source: ICF International, Demographic and Health Surveys.Source: ICF International, Demographic and Health Surveys. Source: International, Demographic and Health Surveys. Source: Census Bureau: 1970 to 2002 March Current Population Survey; 2003 to 2014 Annual Social and Economic Supplement to the Current Population Survey; American Community Survey Brief 11-10 (Oct. 2012); and PRB analysis of data from the 2013 American Community Survey. Percent of Young Women Married by Age 15 (numbers in white) and Age 18 (numbers in black)Percent of Demand for Family Planning Satis ed by Modern Contraceptive MethodsPercent Who Have Completed College, by Age Percent of Currently Married Women Who Have a Say in Decisions About This Topic Percent Who Have Used an Account at a Formal Financial Institution 837673654941271718192021991–19922141992201120002011199–199420121992PeruEgyptEthiopiaBangladeshNiger4728472919167 2 3 3 Percent of Women Using Financial Services by Type, 2014 Mobile Financial Other Formal Financial Institution te d'Ivoire Tanzania Female-to-Male Median Earnings Ratio Among Full-Time Year-Round Workers1993High School Some College, No DegreeBachelor’s Degree Bachelor’s Degree or MoreRatios are expressed as a percent.Percent Who Agree That Husband Is Justi ed Beating Wife if She Leaves the House Without Informing HimAcceptance of Wife Beating Recedes Violence against women poses a serious challenge to women’s empowerment. Combating such violence often requires changing the attitudes and beliefs of both men and women. In fact, in some countries, substantial percentages of women actually agree that a husband has the right to beat a wife under certain circumstances. Many of these women believe a husband is justi ed in hitting a wife ries. For example, in 2013, 13 percent of Nigerian men and 25 percent of Nigerian women viewed a wife leaving home without telling the husband as justi cation for wife beating, down from 19 percent and 32 percent, respectively, in 2008. Zambia also showed notable drops for both men and women between 2007 and 2013-2014. Globally, however, there is still a long path to achieve zero global tolerance of this harmful practice. Source: ICF International, Demographic and Health Surveys. Women MOST POPULOUS COUNTRIES,2015 AND 2050COUNTRY, 2050POPULATION COUNTRY, 2015POPULATION COUNTRIESWITH THE HIGHEST AND LOWEST TOTAL FERTILITY RATESCongo, Dem. Rep. POPULATION CLOCK,2015MORE DEVELOPED LESS DEVELOPED 7,336,435,0001,254,199,0006,082,235,000Year145,973,00013,760,000132,213,000399,92637,700362,226278252Year57,052,00012,283,00044,769,000156,30633,652122,65410923Natural increase perYear88,921,0001,477,00087,444,000243,6204,047239,573169166Year5,351,00073,0005,278,00014,660 201 14,459 10 0.1 10 Korea, SouthTaiwanGreeceSingapore Worldwide average life expectancy in years—7.3$15,030Average global gross capita—$39,020 in more INFORM | EMPOWER | ADVANCE | www.prb.org POPULATION REFERENCE BUREAU2015 World Population Data Sheet with a special focus on women’s empowerment © 2015 Population Reference Bureau 2015 WORLD POPULATION DATA SHEET The authors gratefully acknowledge the valuable assistance of PRB senior consultant, Carl Haub; PRB staff members John May, Kelvin Pollard, Donna Clifton, Carolyn Lamere, Heather Randall, and Nicole LaGrone; PRB interns Heather Zaccaro, Adaeze Ezeofor, and Kimberly Rightor; and staff of the International Programs Center of the U.S. Census Bureau; the United Nations (UN) Population Division; and the Institut national d’etudes démographiques (INED), Paris, in the preparation of this year’s World Population Data Sheet.This publication is funded by the William and Flora Hewlett Foundation, the David and Lucile Packard Foundation, the U.S. Agency for Interna-tional Development (IDEA Project, No. AID-0AA-A-10-00009), and supporters. The contents are the responsibility of the Population Reference Bureau and do not necessarily re ect the views of USAID or the United States government.The Data Sheet lists all geopolitical entities with populations of 150,000 or more and all mem-bers of the UN. These include sovereign states, dependencies, overseas departments, and some territories whose status or boundaries may be undetermined or in dispute. More developedregions, following the UN classi cation, comprise all of Europe and North America, plus Australia, Japan, and New Zealand. All other regions and countries are classi ed as less developed. The least developed countries consist of 48 coun-tries with especially low incomes, high economic vulnerability, and poor human development indi-cators; 34 of these countries are in sub-Saharan Africa, 13 in Asia, and one in the Caribbean. The criteria and list of countries, as de ned by the UN, can be found at http://unohrlls.org/about-ldcs/.Sub-Saharan Africa: All countries of Africa except the northern African countries of Algeria, Egypt, Libya, Morocco, Sudan, Tunisia, and Western Sahara.World and Regional Totals: Regional population totals are independently rounded and include small countries or areas not shown. Regional and world rates and percentages are weighted averages of countries for which data are available. For most indicators, regional averages are shown when data or estimates are available for at least three-quarters of the region’s population. ForSecondary School Enrollment Ratios, HIV Prevalence Rates, and Female Share of Nonagricultural Wage Earn-ers, regional averages are shown when data or estimates are available for at least half of the region’s population.World Population Data Sheets from different years should not be used as a time seriesFluctuations in values from year to year often re ect revisions based on new data or estimates rather than actual changes in levels. Additional information on likely trends and consistent time series can be obtained from PRB, and are also available from UN and U.S. Census Bureau publi-cations and websites.The rates and  gures are primarily compiled from the following sources: of cial country statistical yearbooks, bulletins, and websites; the UN Demographic Yearbook, 2013; and Population and Vital Statistics Report of the UN Statistics Division; World Population Prospects: The 2015 Revision of the UN Population Division; and the International Data Base of the International Programs Center, U.S. Census Bureau. Other sources include recent demographic surveys such as the Demographic and Health Surveys, Multiple Indicator Cluster Surveys, special studies, and direct communication with demographers and statistical bureaus in the United States and abroad. Speci c data sources may be obtained by contacting the authors of the 2015 World Population Data Sheet. For countries with complete registration of births and deaths, rates are those most recently reported. For more developed countries, nearly all vital rates refer to 2014 or 2013.Mid-2015 PopulationEstimates are based on a recent census, of cial national data, or PRB, UN, and U.S. Census Bureau projections. The effects of refugee movements, large numbers of foreign workers, and population shifts due to contemporary political events are taken into account to the extent possible.Birth and Death RateThe annual number of births and deaths per 1,000 total population. These rates are often referred to as “crude rates” since they do not take a population’s age structure into account. Thus, crude death rates in more developed countries with a relatively large proportion of high-mortality older population are often higher than those in less developed countries with lower life expectancy.Net MigrationThe estimated rate of net immigration (immigration minus emigration) per 1,000 population for a recent year based upon the of cial national rate or derived as a residual from estimated birth, death, and population growth rates. Migration rates can vary substantially from year to year for any particular country, as can the de nition of an immigrant.Projected Population, 2030 and 2050Projected populations based on reasonable assumptions on the future course of fertility, mortality, and migration. Projections are based on of cial country projections, series issued by the UN or the U.S. Census Bureau, or PRB projections.Infant Mortality RateThe annual number of deaths of infants under age 1 per 1,000 live births. Rates shown with decimals indicate national statistics reported as completely registered, while those without are estimates from the sources cited above. Rates shown in italics are based upon fewer than 50 annual infant deaths and, as a result, are subject to considerable yearly variability; rates shown for such countries are averages for a multiple-year period. Total Fertility Rate (TFR)The average number of children a woman would have assuming that current age-speci c birth rates remain constant throughout her childbearing years (usually considered to be ages 15 to 49).Population Under Age 15/Age 65+The percentage of the total population in those ages, which are often considered the “dependent ages.” GNI PPP per Capita, 2014 (US$)GNI PPP per capita is gross national income in purchasing power parity (PPP) divided by mid-year population. GNI PPP refers to gross national income converted to “international” dollars using a purchasing power parity conversion factor. PPP adjusts exchange rates to relative purchasing power in different countries, providing a more ac-curate basis of comparison for GNI. Data are from the World Bank. Figures in italics are for 2013, 2012, or 2011.Percent UrbanPercentage of the total population living in areas termed “urban” by that country or by the UN. Countries de ne urban in many different ways, from population centers of 100 or more dwellings to only the population living in national and provincial capitals.Population per Square Kilometer of Arable LandThe mid-year 2015 population divided by the square kilometers of arable land. Arable land is de ned by the UN Food and Agriculture Organization (FAO) to include “the land under temporary agricultural crops (multiple-cropped areas are counted only once), temporary meadows for mowing or pasture, land under market and kitchen gardens and land temporarily fallow (less than  ve years).” Data for the percent of land that is arable and the square kilometers in a country are from the FAO.Contraceptive UseThe percentage of currently married or “in union” women of reproductive age who are currently using any form of contraception. Modern methods include clinic and supply methods such as the pill, IUD, condom, and sterilization. Data are from the most recently available national-level surveys, such as Demographic and Health Surveys, Reproductive Health Surveys, Multiple Indicator Cluster Surveys, regional survey programs, national surveys, and the UN Population Division World Contraceptive Use 2014. Data prior to 2009 are shown in italics.Life Expectancy at BirthThe average number of years a newborn infant can expect to live under current mortality rates. Maternal Deaths per 100,000 Births Maternal deaths in a time period divided by the number of live births in the same period, expressed per 100,000 live births. A maternal death is de ned by the World Health Organization (WHO) as “the death of a woman while pregnant or within 42 days of the termination of pregnancy, irrespective of the duration and site of the pregnancy, from any cause to or aggravated by the pregnancy or its management but not from accidental or incidental causes.” Data are from the 2014 report Trends in Maternal Mortality: 1990 to 2013 that compiles estimates by WHO, UNICEF, UNFPA, the World Bank, and the UN Population Division. HIV Prevalence The proportion of the population living with HIV regardless of the time of infection, knowledge of the infection, or stage of the disease. Data are from UNAIDS.Secondary School Enrollment RatioThe number of students enrolled in secondary education divided by the secondary-school-age population (Gross Enrollment Ratio). The ratio can be over 100 when there are students enrolled who are older or younger than the age expected for secondary school students. Data are from UNESCO for 2008-2014. Tertiary School Gender Parity IndexThe tertiary education gross enrollment ratio for women divided by the tertiary gross enrollment ratio for men. An index less than one indicates that men are more represented in higher education than women, while an index greater than one indicates that women are more represented. Data are from UNESCO for 2008-2014.Gender Ratio of Labor Force Participation RatesThe ratio of the female labor force participation rate over the male rate. The labor force participation rate is de ned as the proportion of the population ages 15 years and older who are economically active, including those employed and unemployed. A ratio less than one indicates that the male labor force participation rate is greater than the female rate while a ratio of more than one indicates that the female rate is greater than the male rate. Data are from the World Bank for 2013. Female Share of Nonagricultural Wage EarnersThe percent of workers in wage employment in the nonagricultural sector who are women. In a small number of countries the de nition of the sector is one of the following: the economically active population in nonagriculture, total employment, total employment in nonagriculture, total paid employment, and employment in the public sector. Data are from the UN from 2008-2013. Female Share of Parliament MembersThe percentage of seats in a country’s single chamber, combined higher and lower chambers of the national parliament, or other national legislature held by women. Data are from the Inter-Parliamentary Union from May 1, 2015. Acknowledgments, Notes, Sources, and De nitionsPOPULATION REFERENCE BUREAU people around the world about population, health, and the environment, and them to the well-being of current and future generations.1875 Connecticut Ave., NW, Suite 520, Washington, DC 20009 USAtel. 202-483-1100 • fax 202-328-3937 • e-mail: popref@prb.org • website: www.prb.org If you value PRB’s World Population Data Sheet and are among the tens of thousands of people who eagerly anticipate its publication each year, please consider making a contribution to PRB. Your donation will help ensure that PRB can maintain its commitment to keeping the as affordable as possible. Visit our website to donate now: www.prb.org.research to provide the most objective, accurate, that are easily understood by advocates, journalists, and decisionmakers alike.INNOVATIVE TOOLS.PRB creates interactive content to make data and research more how projections of U.S. child poverty and the viewer. INFLUENTIAL PUBLICATIONS.looks at gaps in key development indicators between urban and rural dwellers in many low- and middle-income countries. MULTIMEDIA.PRB has produced hundreds of cutting-edge video and audio presentations PRB’s website provides access to all of our content, including our respected Data Sheets, visualizations, and data and analysis on world issues ranging from gender to aging to family PRB empowers people—researchers, journalists, policymakers, and educators—to use information about population, health, and the environment to encourage action. Frequently, people have information but lack the skills and tools needed to communicate effectively to decisionmakers. PRB builds coalitions and conducts trainings to share techniques to inform policy. PRB strengthens the capacity of journalists from developing countries through seminars and study tours. We organized several study tours for journalists in to visit projects and the people they affect.POLICY COMMUNICATION TRAINING.In the past  ve years, PRB has trained more than 1,000 professionals in Asia, Africa, and Latin America to communicate data and research effectively. Each year, for example, we have sponsored two workshops with Kenya’s National Council for Population and Development, training local and regional policymakers, program managers, and advocates. PRB developed and coordinates the American Community Survey (ACS) Data Users Group to increase understanding of the value and utility of ACS data and to facilitate key ACS data issues and applications. This group connects ACS data users and helps them share information and materials through an online community forum, webinars, special sessions at professional meetings, and an annual conference.ADVANCEPRB works to ensure that policymakers worldwide rely on sound evidence, rather than anecdotal or and environmental policies. While the numbers of publications created or workshops conducted are one way to measure PRB’s work, the adoption of evidence-based policies, increased demand for health services, and active coalitions are better gauges of progress toward positive social change. PRB provides analysis for the KIDS COUNT Data Book, an annual report card on the well-being of children and families in the United States. The Data Book has helped promote the passage of several U.S. policies, including the State Children’s Health Insurance Program. DEMAND FOR HEALTH SERVICES.TV reporting in India by an alumna of PRB’s Women’s Edition training program led to the creation of health camps to care for pregnant women in the slums. Another led to the renewal of a family planning program that promoted birth spacing. East Africa Population, Health, and Environment Network to increase information sharing across the region. In the Lake Victoria Basin, PRB also provides technical assistance on integrated population, health, and environment development in the region. PRB’s 2015 World Population Data Sheetis available in English, French, and Spanish at www.prb.org. Also online:A customized Data Dashboard where users can view multiple indicators for regions or countries.A video focusing on what the data say about the state of women’s empowerment. An interactive world map illustrating key demographic variables by country and region.To order PRB publications (discounts available for bulk orders):Online at www.prb.org.E-mail: popref@prb.org.Call toll-free: 800-877-9881.Fax: 202-328-3937.Mail: 1875 Connecticut Ave., NW, Suite 520, Washington, DC 20009.Data prepared by PRB demographers Toshiko Kaneda and Kristin Bietsch.© August 2015. Population Reference Bureau.All rights reserved. ISSN 0085-8315Photo credit, cover: © Jörg Dickmann, goZOOMA WomenWomenWomenWomenWomenWomenshow percent in 2011show percent in 2014 Financial Inclusion of Women ExpandsFinancial inclusion—making appropriate, affordable, and convenient  nancial services available to all people—is a global development priority. For women, access to savings, credit, and other services can help them gain more  nancial independence, better manage and leverage their resources, and build capital to support income-generating activities. A core measure of  nancial inclusion is whether an individual uses an account at a bank or other formal  nancial institution. In most countries, even many least developed ones, the share of women with such accounts has increased over the past few years. Gaps remain between men and women, but these have narrowed in many cases, and most developed countries show effective gender parity at high levels of usage. Rapid expansion of mobile money and other  nancial services available via mobile devices, particularly in Africa, provide a convenient way for both men and women to access such services. Women are currently using mobile more than other formal accounts in several African countries (see table).Source: World Bank, Global Findex Database. WORLD POPULATION HIGHLIGHTSFOCUS ON WOMEN’S EMPOWERMENT Large Purchases Jordan 010203070100172018151832274753665737426574667583748488917177896479725617 KenyaEgyptPhilippinesPakistanJordanSenegalNigeria20142010 2006 2002 1998 1994 1990 6441587140362113314313524780 Women 25-29Women 25+ Rates of Early Marriage Fall, Particularly Among Those Under 15 Early marriage (before age 18) undermines the rights and livelihood opportunities of adolescent girls by leaving them vulnerable to the health risks of early pregnancy and childbearing, and prematurely ending their schooling. Rates of early marriage have declined broadly in the past 20 years, particularly among girls who are under age 15. Part of the overall decline re ects improvements in girls’ access to education: As girls educational attainment improves, the proportion marrying early tends to fall. Better employment opportunities for women and girls arriage among rural migrants under age 15. The percentage of Bangladeshi girls married by age 18 has declined much more slowly as the youngest potential brides tend to postpone marriage by only a few years. The majority of Bangladeshi girls continue to marry before age 18. Women Post Uneven Gains in Household Decisionmaking PowerMarried women in many countries are increasingly likely to have a say in household decisions, but these gains do not necessarily apply to every type of decision. When women are included in decisions about household spending, more money tends to be spent for the bene t of women and children. And when women are able to make decisions about their health care, they are less vulnerable to preventable diseases. Progress in these areas has varied by country, and even in countries showing notable gains, many women still do not engage in all types of important decisions. For example, in Nepal, only 66 percent of women have a say about their own health care decisions. The same percentage of Zambian women have the opportunity to make decisions about large household purchases. Family Planning Needs Increasingly Met by Modern Methods, but More Progress Needed “Demand for family planning satis ed with modern methods” has emerged as a key indicator of contraceptive availability and use. The indicator measures the proportion of women who want to delay or limit childbearing and who are using modern methods of contraception. Family planning experts have urged countries to strive for meeting at least 75 percent of demand with modern methods. Over the past two decades, a signi cant number of less developed countries have seen increases in the share of demand satis ed with modern methods, but many countries remain far below the proposed 75 percent benchmark. They will need to accelerate progress over the coming decade so that increased contraceptive use can translate into improved maternal and child health, slower population growth, increased economic well-being, and environmental sustainability. U.S. Gender Gap in College Completion Eases; Earnings Gap Persists Educational attainment in the United States has risen substantially over the last four decades. Between 1970 and 2014, the share of men ages 25 and older with at least a college degree climbed from 14 percent to 32 percent, while the share of adult women with at least a college degree quadrupled from 8 percent to 32 percent. For ages 25 to 29 only, the share of women with a bachelor’s degree or higher actually started outpacing the share for men in 1991. But women still lag behind men in earnings. Among full-time, year-round workers ages 25 and older in 2013, women’s median earnings were about 79 percent of men’s, up from 71 percent in 1993 (see table). This gender earnings gap persists across all educational levels. For bachelor’s degree holders, one factor may be that women are less likely to get degrees in higher-earning  elds such as science and engineering. In 2013, among adults ages 25 and older with a bachelor’s degree, only 26 percent of women had a degree in science and engineering, compared with 44 percent of men. However, even among full-time, year-round workers with engineering degrees, women’s median earnings in 2011 were only 83 percent of men’s. Data points are for each corresponding survey year.Source: ICF International, Demographic and Health Surveys. Source: ICF International, Demographic and Health Surveys.Source: International, Demographic and Health Surveys.Source: Census Bureau: 1970 to 2002 March Current Population Survey; 2003 to 2014 Annual Social and Economic Supplement to the Current Population Survey; American Community Survey Brief 11-10 (Oct. 2012); and PRB analysis of data from the 2013 American Community Survey. Percent of Young Women Married by Age 15 (numbers in white) and Age 18 (numbers in black) Percent of Demand for Family Planning Satis ed by Modern Contraceptive Methods Percent Who Have Completed College, by AgePercent of Currently Married Women Who Have a Say in Decisions About This TopicPercent Who Have Used an Account at a Formal Financial Institution 837673654941271718192021991–19922141992201120002011199–199420121992PeruEgyptEthiopiaBangladeshNiger4728472919167 2 3 3 Percent of Women Using Financial Services by Type, 2014 Mobile Financial Other Formal Financial Institution te d'Ivoire Tanzania Female-to-Male Median Earnings Ratio Among Full-Time Year-Round Workers1993High School Some College, No DegreeBachelor’s Degree Bachelor’s Degree or MoreRatios are expressed as a percent.Percent Who Agree That Husband Is Justi ed Beating Wife if She Leaves the House Without Informing HimAcceptance of Wife Beating Recedes Violence against women poses a serious challenge to women’s empowerment. Combating such violence often requires changing the attitudes and beliefs of both men and women. In fact, in some countries, substantial percentages of women actually agree that a husband has the right to beat a wife under certain circumstances. Many of these women believe a husband is justi ed in hitting a wife ries. For example, in 2013, 13 percent of Nigerian men and 25 percent of Nigerian women viewed a wife leaving home without telling the husband as justi cation for wife beating, down from 19 percent and 32 percent, respectively, in 2008. Zambia also showed notable drops for both men and women between 2007 and 2013-2014. Globally, however, there is still a long path to achieve zero global tolerance of this harmful practice. Source: ICF International, Demographic and Health Surveys. Women MOST POPULOUS COUNTRIES,2015 AND 2050COUNTRY, 2050POPULATION COUNTRY, 2015POPULATION COUNTRIESWITH THE HIGHEST AND LOWEST TOTAL FERTILITY RATESCongo, Dem. Rep. POPULATION CLOCK,2015MORE DEVELOPED LESS DEVELOPED 7,336,435,0001,254,199,0006,082,235,000Year145,973,00013,760,000132,213,000399,92637,700362,226278252Year57,052,00012,283,00044,769,000156,30633,652122,65410923Natural increase perYear88,921,0001,477,00087,444,000243,6204,047239,573169166Year5,351,00073,0005,278,00014,660 201 14,459 10 0.1 10 Korea, SouthTaiwanGreeceSingapore Worldwide average life expectancy in years—7.3$15,030Average global gross capita—$39,020 in more INFORM | EMPOWER | ADVANCE | www.prb.org POPULATION REFERENCE BUREAU2015 World Population Data Sheet with a special focus on women’s empowerment © 2015 Population Reference Bureau 2015 WORLD POPULATION DATA SHEET The authors gratefully acknowledge the valuable assistance of PRB senior consultant, Carl Haub; PRB staff members John May, Kelvin Pollard, Donna Clifton, Carolyn Lamere, Heather Randall, and Nicole LaGrone; PRB interns Heather Zaccaro, Adaeze Ezeofor, and Kimberly Rightor; and staff of the International Programs Center of the U.S. Census Bureau; the United Nations (UN) Population Division; and the Institut national d’etudes démographiques (INED), Paris, in the preparation of this year’s World Population Data Sheet.This publication is funded by the William and Flora Hewlett Foundation, the David and Lucile Packard Foundation, the U.S. Agency for Interna-tional Development (IDEA Project, No. AID-0AA-A-10-00009), and supporters. The contents are the responsibility of the Population Reference Bureau and do not necessarily re ect the views of USAID or the United States government.The Data Sheet lists all geopolitical entities with populations of 150,000 or more and all mem-bers of the UN. These include sovereign states, dependencies, overseas departments, and some territories whose status or boundaries may be undetermined or in dispute. More developedregions, following the UN classi cation, comprise all of Europe and North America, plus Australia, Japan, and New Zealand. All other regions and countries are classi ed as less developed. The least developed countries consist of 48 coun-tries with especially low incomes, high economic vulnerability, and poor human development indi-cators; 34 of these countries are in sub-Saharan Africa, 13 in Asia, and one in the Caribbean. The criteria and list of countries, as de ned by the UN, can be found at http://unohrlls.org/about-ldcs/.Sub-Saharan Africa: All countries of Africa except the northern African countries of Algeria, Egypt, Libya, Morocco, Sudan, Tunisia, and Western Sahara.World and Regional Totals: Regional population totals are independently rounded and include small countries or areas not shown. Regional and world rates and percentages are weighted averages of countries for which data are available. For most indicators, regional averages are shown when data or estimates are available for at least three-quarters of the region’s population. ForSecondary School Enrollment Ratios, HIV Prevalence Rates, and Female Share of Nonagricultural Wage Earn-ers, regional averages are shown when data or estimates are available for at least half of the region’s population.World Population Data Sheets from different years should not be used as a time seriesFluctuations in values from year to year often re ect revisions based on new data or estimates rather than actual changes in levels. Additional information on likely trends and consistent time series can be obtained from PRB, and are also available from UN and U.S. Census Bureau publi-cations and websites.The rates and  gures are primarily compiled from the following sources: of cial country statistical yearbooks, bulletins, and websites; the UN Demographic Yearbook, 2013; and Population and Vital Statistics Report of the UN Statistics Division; World Population Prospects: The 2015 Revision of the UN Population Division; and the International Data Base of the International Programs Center, U.S. Census Bureau. Other sources include recent demographic surveys such as the Demographic and Health Surveys, Multiple Indicator Cluster Surveys, special studies, and direct communication with demographers and statistical bureaus in the United States and abroad. Speci c data sources may be obtained by contacting the authors of the 2015 World Population Data Sheet. For countries with complete registration of births and deaths, rates are those most recently reported. For more developed countries, nearly all vital rates refer to 2014 or 2013.Mid-2015 PopulationEstimates are based on a recent census, of cial national data, or PRB, UN, and U.S. Census Bureau projections. The effects of refugee movements, large numbers of foreign workers, and population shifts due to contemporary political events are taken into account to the extent possible.Birth and Death RateThe annual number of births and deaths per 1,000 total population. These rates are often referred to as “crude rates” since they do not take a population’s age structure into account. Thus, crude death rates in more developed countries with a relatively large proportion of high-mortality older population are often higher than those in less developed countries with lower life expectancy.Net MigrationThe estimated rate of net immigration (immigration minus emigration) per 1,000 population for a recent year based upon the of cial national rate or derived as a residual from estimated birth, death, and population growth rates. Migration rates can vary substantially from year to year for any particular country, as can the de nition of an immigrant.Projected Population, 2030 and 2050Projected populations based on reasonable assumptions on the future course of fertility, mortality, and migration. Projections are based on of cial country projections, series issued by the UN or the U.S. Census Bureau, or PRB projections.Infant Mortality RateThe annual number of deaths of infants under age 1 per 1,000 live births. Rates shown with decimals indicate national statistics reported as completely registered, while those without are estimates from the sources cited above. Rates shown in italics are based upon fewer than 50 annual infant deaths and, as a result, are subject to considerable yearly variability; rates shown for such countries are averages for a multiple-year period. Total Fertility Rate (TFR)The average number of children a woman would have assuming that current age-speci c birth rates remain constant throughout her childbearing years (usually considered to be ages 15 to 49).Population Under Age 15/Age 65+The percentage of the total population in those ages, which are often considered the “dependent ages.” GNI PPP per Capita, 2014 (US$)GNI PPP per capita is gross national income in purchasing power parity (PPP) divided by mid-year population. GNI PPP refers to gross national income converted to “international” dollars using a purchasing power parity conversion factor. PPP adjusts exchange rates to relative purchasing power in different countries, providing a more ac-curate basis of comparison for GNI. Data are from the World Bank. Figures in italics are for 2013, 2012, or 2011.Percent UrbanPercentage of the total population living in areas termed “urban” by that country or by the UN. Countries de ne urban in many different ways, from population centers of 100 or more dwellings to only the population living in national and provincial capitals.Population per Square Kilometer of Arable LandThe mid-year 2015 population divided by the square kilometers of arable land. Arable land is de ned by the UN Food and Agriculture Organization (FAO) to include “the land under temporary agricultural crops (multiple-cropped areas are counted only once), temporary meadows for mowing or pasture, land under market and kitchen gardens and land temporarily fallow (less than  ve years).” Data for the percent of land that is arable and the square kilometers in a country are from the FAO.Contraceptive UseThe percentage of currently married or “in union” women of reproductive age who are currently using any form of contraception. Modern methods include clinic and supply methods such as the pill, IUD, condom, and sterilization. Data are from the most recently available national-level surveys, such as Demographic and Health Surveys, Reproductive Health Surveys, Multiple Indicator Cluster Surveys, regional survey programs, national surveys, and the UN Population Division World Contraceptive Use 2014. Data prior to 2009 are shown in italics.Life Expectancy at BirthThe average number of years a newborn infant can expect to live under current mortality rates. Maternal Deaths per 100,000 Births Maternal deaths in a time period divided by the number of live births in the same period, expressed per 100,000 live births. A maternal death is de ned by the World Health Organization (WHO) as “the death of a woman while pregnant or within 42 days of the termination of pregnancy, irrespective of the duration and site of the pregnancy, from any cause to or aggravated by the pregnancy or its management but not from accidental or incidental causes.” Data are from the 2014 report Trends in Maternal Mortality: 1990 to 2013 that compiles estimates by WHO, UNICEF, UNFPA, the World Bank, and the UN Population Division. HIV Prevalence The proportion of the population living with HIV regardless of the time of infection, knowledge of the infection, or stage of the disease. Data are from UNAIDS.Secondary School Enrollment RatioThe number of students enrolled in secondary education divided by the secondary-school-age population (Gross Enrollment Ratio). The ratio can be over 100 when there are students enrolled who are older or younger than the age expected for secondary school students. Data are from UNESCO for 2008-2014. Tertiary School Gender Parity IndexThe tertiary education gross enrollment ratio for women divided by the tertiary gross enrollment ratio for men. An index less than one indicates that men are more represented in higher education than women, while an index greater than one indicates that women are more represented. Data are from UNESCO for 2008-2014.Gender Ratio of Labor Force Participation RatesThe ratio of the female labor force participation rate over the male rate. The labor force participation rate is de ned as the proportion of the population ages 15 years and older who are economically active, including those employed and unemployed. A ratio less than one indicates that the male labor force participation rate is greater than the female rate while a ratio of more than one indicates that the female rate is greater than the male rate. Data are from the World Bank for 2013. Female Share of Nonagricultural Wage EarnersThe percent of workers in wage employment in the nonagricultural sector who are women. In a small number of countries the de nition of the sector is one of the following: the economically active population in nonagriculture, total employment, total employment in nonagriculture, total paid employment, and employment in the public sector. Data are from the UN from 2008-2013. Female Share of Parliament MembersThe percentage of seats in a country’s single chamber, combined higher and lower chambers of the national parliament, or other national legislature held by women. Data are from the Inter-Parliamentary Union from May 1, 2015. Acknowledgments, Notes, Sources, and De nitionsPOPULATION REFERENCE BUREAU people around the world about population, health, and the environment, and them to the well-being of current and future generations.1875 Connecticut Ave., NW, Suite 520, Washington, DC 20009 USAtel. 202-483-1100 • fax 202-328-3937 • e-mail: popref@prb.org • website: www.prb.org If you value PRB’s World Population Data Sheet and are among the tens of thousands of people who eagerly anticipate its publication each year, please consider making a contribution to PRB. Your donation will help ensure that PRB can maintain its commitment to keeping the as affordable as possible. Visit our website to donate now: www.prb.org.research to provide the most objective, accurate, that are easily understood by advocates, journalists, and decisionmakers alike.INNOVATIVE TOOLS.PRB creates interactive content to make data and research more how projections of U.S. child poverty and the viewer. INFLUENTIAL PUBLICATIONS.looks at gaps in key development indicators between urban and rural dwellers in many low- and middle-income countries. MULTIMEDIA.PRB has produced hundreds of cutting-edge video and audio presentations PRB’s website provides access to all of our content, including our respected Data Sheets, visualizations, and data and analysis on world issues ranging from gender to aging to family PRB empowers people—researchers, journalists, policymakers, and educators—to use information about population, health, and the environment to encourage action. Frequently, people have information but lack the skills and tools needed to communicate effectively to decisionmakers. PRB builds coalitions and conducts trainings to share techniques to inform policy. PRB strengthens the capacity of journalists from developing countries through seminars and study tours. We organized several study tours for journalists in to visit projects and the people they affect.POLICY COMMUNICATION TRAINING.In the past  ve years, PRB has trained more than 1,000 professionals in Asia, Africa, and Latin America to communicate data and research effectively. Each year, for example, we have sponsored two workshops with Kenya’s National Council for Population and Development, training local and regional policymakers, program managers, and advocates. PRB developed and coordinates the American Community Survey (ACS) Data Users Group to increase understanding of the value and utility of ACS data and to facilitate key ACS data issues and applications. This group connects ACS data users and helps them share information and materials through an online community forum, webinars, special sessions at professional meetings, and an annual conference.ADVANCEPRB works to ensure that policymakers worldwide rely on sound evidence, rather than anecdotal or and environmental policies. While the numbers of publications created or workshops conducted are one way to measure PRB’s work, the adoption of evidence-based policies, increased demand for health services, and active coalitions are better gauges of progress toward positive social change. PRB provides analysis for the KIDS COUNT Data Book, an annual report card on the well-being of children and families in the United States. The Data Book has helped promote the passage of several U.S. policies, including the State Children’s Health Insurance Program. DEMAND FOR HEALTH SERVICES.TV reporting in India by an alumna of PRB’s Women’s Edition training program led to the creation of health camps to care for pregnant women in the slums. Another led to the renewal of a family planning program that promoted birth spacing. East Africa Population, Health, and Environment Network to increase information sharing across the region. In the Lake Victoria Basin, PRB also provides technical assistance on integrated population, health, and environment development in the region. PRB’s 2015 World Population Data Sheetis available in English, French, and Spanish at www.prb.org. Also online:A customized Data Dashboard where users can view multiple indicators for regions or countries.A video focusing on what the data say about the state of women’s empowerment. An interactive world map illustrating key demographic variables by country and region.To order PRB publications (discounts available for bulk orders):Online at www.prb.org.E-mail: popref@prb.org.Call toll-free: 800-877-9881.Fax: 202-328-3937.Mail: 1875 Connecticut Ave., NW, Suite 520, Washington, DC 20009.Data prepared by PRB demographers Toshiko Kaneda and Kristin Bietsch.© August 2015. Population Reference Bureau.All rights reserved. ISSN 0085-8315Photo credit, cover: © Jörg Dickmann, goZOOMA WomenWomenWomenWomenWomenWomenshow percent in 2011show percent in 2014 Financial Inclusion of Women ExpandsFinancial inclusion—making appropriate, affordable, and convenient  nancial services available to all people—is a global development priority. For women, access to savings, credit, and other services can help them gain more  nancial independence, better manage and leverage their resources, and build capital to support income-generating activities. A core measure of  nancial inclusion is whether an individual uses an account at a bank or other formal  nancial institution. In most countries, even many least developed ones, the share of women with such accounts has increased over the past few years. Gaps remain between men and women, but these have narrowed in many cases, and most developed countries show effective gender parity at high levels of usage. Rapid expansion of mobile money and other  nancial services available via mobile devices, particularly in Africa, provide a convenient way for both men and women to access such services. Women are currently using mobile more than other formal accounts in several African countries (see table).Source: World Bank, Global Findex Database. WORLD POPULATION HIGHLIGHTSFOCUS ON WOMEN’S EMPOWERMENT Large Purchases Jordan 010203070100172018151832274753665737426574667583748488917177896479725617 KenyaEgyptPhilippinesPakistanJordanSenegalNigeria 20142010 2006 2002 1998 1994 1990 6441587140362113314313524780 Women 25-29Women 25+ Rates of Early Marriage Fall, Particularly Among Those Under 15 Early marriage (before age 18) undermines the rights and livelihood opportunities of adolescent girls by leaving them vulnerable to the health risks of early pregnancy and childbearing, and prematurely ending their schooling. Rates of early marriage have declined broadly in the past 20 years, particularly among girls who are under age 15. Part of the overall decline re ects improvements in girls’ access to education: As girls educational attainment improves, the proportion marrying early tends to fall. Better employment opportunities for women and girls arriage among rural migrants under age 15. The percentage of Bangladeshi girls married by age 18 has declined much more slowly as the youngest potential brides tend to postpone marriage by only a few years. The majority of Bangladeshi girls continue to marry before age 18. Women Post Uneven Gains in Household Decisionmaking PowerMarried women in many countries are increasingly likely to have a say in household decisions, but these gains do not necessarily apply to every type of decision. When women are included in decisions about household spending, more money tends to be spent for the bene t of women and children. And when women are able to make decisions about their health care, they are less vulnerable to preventable diseases. Progress in these areas has varied by country, and even in countries showing notable gains, many women still do not engage in all types of important decisions. For example, in Nepal, only 66 percent of women have a say about their own health care decisions. The same percentage of Zambian women have the opportunity to make decisions about large household purchases.Family Planning Needs Increasingly Met by Modern Methods, but More Progress Needed “Demand for family planning satis ed with modern methods” has emerged as a key indicator of contraceptive availability and use. The indicator measures the proportion of women who want to delay or limit childbearing and who are using modern methods of contraception. Family planning experts have urged countries to strive for meeting at least 75 percent of demand with modern methods. Over the past two decades, a signi cant number of less developed countries have seen increases in the share of demand satis ed with modern methods, but many countries remain far below the proposed 75 percent benchmark. They will need to accelerate progress over the coming decade so that increased contraceptive use can translate into improved maternal and child health, slower population growth, increased economic well-being, and environmental sustainability.U.S. Gender Gap in College Completion Eases; Earnings Gap Persists Educational attainment in the United States has risen substantially over the last four decades. Between 1970 and 2014, the share of men ages 25 and older with at least a college degree climbed from 14 percent to 32 percent, while the share of adult women with at least a college degree quadrupled from 8 percent to 32 percent. For ages 25 to 29 only, the share of women with a bachelor’s degree or higher actually started outpacing the share for men in 1991. But women still lag behind men in earnings. Among full-time, year-round workers ages 25 and older in 2013, women’s median earnings were about 79 percent of men’s, up from 71 percent in 1993 (see table). This gender earnings gap persists across all educational levels. For bachelor’s degree holders, one factor may be that women are less likely to get degrees in higher-earning  elds such as science and engineering. In 2013, among adults ages 25 and older with a bachelor’s degree, only 26 percent of women had a degree in science and engineering, compared with 44 percent of men. However, even among full-time, year-round workers with engineering degrees, women’s median earnings in 2011 were only 83 percent of men’s. Data points are for each corresponding survey year.Source: ICF International, Demographic and Health Surveys.Source: ICF International, Demographic and Health Surveys.Source: International, Demographic and Health Surveys.Source: Census Bureau: 1970 to 2002 March Current Population Survey; 2003 to 2014 Annual Social and Economic Supplement to the Current Population Survey; American Community Survey Brief 11-10 (Oct. 2012); and PRB analysis of data from the 2013 American Community Survey. Percent of Young Women Married by Age 15 (numbers in white) and Age 18 (numbers in black)Percent of Demand for Family Planning Satis ed by Modern Contraceptive MethodsPercent Who Have Completed College, by AgePercent of Currently Married Women Who Have a Say in Decisions About This TopicPercent Who Have Used an Account at a Formal Financial Institution 837673654941271718192021991–19922141992201120002011199–199420121992PeruEgyptEthiopiaBangladeshNiger4728472919167 2 3 3 Percent of Women Using Financial Services by Type, 2014 Mobile Financial Other Formal Financial Institution te d'Ivoire Tanzania Female-to-Male Median Earnings Ratio Among Full-Time Year-Round Workers1993High School Some College, No DegreeBachelor’s Degree Bachelor’s Degree or MoreRatios are expressed as a percent. Percent Who Agree That Husband Is Justi ed Beating Wife if She Leaves the House Without Informing HimAcceptance of Wife Beating Recedes Violence against women poses a serious challenge to women’s empowerment. Combating such violence often requires changing the attitudes and beliefs of both men and women. In fact, in some countries, substantial percentages of women actually agree that a husband has the right to beat a wife under certain circumstances. Many of these women believe a husband is justi ed in hitting a wife ries. For example, in 2013, 13 percent of Nigerian men and 25 percent of Nigerian women viewed a wife leaving home without telling the husband as justi cation for wife beating, down from 19 percent and 32 percent, respectively, in 2008. Zambia also showed notable drops for both men and women between 2007 and 2013-2014. Globally, however, there is still a long path to achieve zero global tolerance of this harmful practice. Source: ICF International, Demographic and Health Surveys. Women 20132008Nigeria Zambia 20122007Indonesia402652383225191311122424 2013-20143016 20074232 MOST POPULOUS COUNTRIES,2015 AND 2050COUNTRY, 2050POPULATION COUNTRY, 2015POPULATION COUNTRIESWITH THE HIGHEST AND LOWEST TOTAL FERTILITY RATESCongo, Dem. Rep. POPULATION CLOCK,2015MORE DEVELOPED LESS DEVELOPED 7,336,435,0001,254,199,0006,082,235,000Year145,973,00013,760,000132,213,000399,92637,700362,226278252Year57,052,00012,283,00044,769,000156,30633,652122,65410923Natural increase perYear88,921,0001,477,00087,444,000243,6204,047239,573169166Year5,351,00073,0005,278,00014,660 201 14,459 10 0.1 10 Korea, SouthTaiwanGreeceSingapore Worldwide average life expectancy in years—7.3$15,030Average global gross capita—$39,020 in more INFORM | EMPOWER | ADVANCE | www.prb.org POPULATION REFERENCE BUREAU2015 World Population Data Sheet with a special focus on women’s empowerment © 2015 Population Reference Bureau 2015 WORLD POPULATION DATA SHEET The authors gratefully acknowledge the valuable assistance of PRB senior consultant, Carl Haub; PRB staff members John May, Kelvin Pollard, Donna Clifton, Carolyn Lamere, Heather Randall, and Nicole LaGrone; PRB interns Heather Zaccaro, Adaeze Ezeofor, and Kimberly Rightor; and staff of the International Programs Center of the U.S. Census Bureau; the United Nations (UN) Population Division; and the Institut national d’etudes démographiques (INED), Paris, in the preparation of this year’s World Population Data Sheet.This publication is funded by the William and Flora Hewlett Foundation, the David and Lucile Packard Foundation, the U.S. Agency for Interna-tional Development (IDEA Project, No. AID-0AA-A-10-00009), and supporters. The contents are the responsibility of the Population Reference Bureau and do not necessarily re ect the views of USAID or the United States government.The Data Sheet lists all geopolitical entities with populations of 150,000 or more and all mem-bers of the UN. These include sovereign states, dependencies, overseas departments, and some territories whose status or boundaries may be undetermined or in dispute. More developedregions, following the UN classi cation, comprise all of Europe and North America, plus Australia, Japan, and New Zealand. All other regions and countries are classi ed as less developed. The least developed countries consist of 48 coun-tries with especially low incomes, high economic vulnerability, and poor human development indi-cators; 34 of these countries are in sub-Saharan Africa, 13 in Asia, and one in the Caribbean. The criteria and list of countries, as de ned by the UN, can be found at http://unohrlls.org/about-ldcs/.Sub-Saharan Africa: All countries of Africa except the northern African countries of Algeria, Egypt, Libya, Morocco, Sudan, Tunisia, and Western Sahara.World and Regional Totals: Regional population totals are independently rounded and include small countries or areas not shown. Regional and world rates and percentages are weighted averages of countries for which data are available. For most indicators, regional averages are shown when data or estimates are available for at least three-quarters of the region’s population. ForSecondary School Enrollment Ratios, HIV Prevalence Rates, and Female Share of Nonagricultural Wage Earn-ers, regional averages are shown when data or estimates are available for at least half of the region’s population.World Population Data Sheets from different years should not be used as a time seriesFluctuations in values from year to year often re ect revisions based on new data or estimates rather than actual changes in levels. Additional information on likely trends and consistent time series can be obtained from PRB, and are also available from UN and U.S. Census Bureau publi-cations and websites.The rates and  gures are primarily compiled from the following sources: of cial country statistical yearbooks, bulletins, and websites; the UN Demographic Yearbook, 2013; and Population and Vital Statistics Report of the UN Statistics Division; World Population Prospects: The 2015 Revision of the UN Population Division; and the International Data Base of the International Programs Center, U.S. Census Bureau. Other sources include recent demographic surveys such as the Demographic and Health Surveys, Multiple Indicator Cluster Surveys, special studies, and direct communication with demographers and statistical bureaus in the United States and abroad. Speci c data sources may be obtained by contacting the authors of the 2015 World Population Data Sheet. For countries with complete registration of births and deaths, rates are those most recently reported. For more developed countries, nearly all vital rates refer to 2014 or 2013.Mid-2015 PopulationEstimates are based on a recent census, of cial national data, or PRB, UN, and U.S. Census Bureau projections. The effects of refugee movements, large numbers of foreign workers, and population shifts due to contemporary political events are taken into account to the extent possible.Birth and Death RateThe annual number of births and deaths per 1,000 total population. These rates are often referred to as “crude rates” since they do not take a population’s age structure into account. Thus, crude death rates in more developed countries with a relatively large proportion of high-mortality older population are often higher than those in less developed countries with lower life expectancy.Net MigrationThe estimated rate of net immigration (immigration minus emigration) per 1,000 population for a recent year based upon the of cial national rate or derived as a residual from estimated birth, death, and population growth rates. Migration rates can vary substantially from year to year for any particular country, as can the de nition of an immigrant.Projected Population, 2030 and 2050Projected populations based on reasonable assumptions on the future course of fertility, mortality, and migration. Projections are based on of cial country projections, series issued by the UN or the U.S. Census Bureau, or PRB projections.Infant Mortality RateThe annual number of deaths of infants under age 1 per 1,000 live births. Rates shown with decimals indicate national statistics reported as completely registered, while those without are estimates from the sources cited above. Rates shown in italics are based upon fewer than 50 annual infant deaths and, as a result, are subject to considerable yearly variability; rates shown for such countries are averages for a multiple-year period. Total Fertility Rate (TFR)The average number of children a woman would have assuming that current age-speci c birth rates remain constant throughout her childbearing years (usually considered to be ages 15 to 49).Population Under Age 15/Age 65+The percentage of the total population in those ages, which are often considered the “dependent ages.” GNI PPP per Capita, 2014 (US$)GNI PPP per capita is gross national income in purchasing power parity (PPP) divided by mid-year population. GNI PPP refers to gross national income converted to “international” dollars using a purchasing power parity conversion factor. PPP adjusts exchange rates to relative purchasing power in different countries, providing a more ac-curate basis of comparison for GNI. Data are from the World Bank. Figures in italics are for 2013, 2012, or 2011.Percent UrbanPercentage of the total population living in areas termed “urban” by that country or by the UN. Countries de ne urban in many different ways, from population centers of 100 or more dwellings to only the population living in national and provincial capitals.Population per Square Kilometer of Arable LandThe mid-year 2015 population divided by the square kilometers of arable land. Arable land is de ned by the UN Food and Agriculture Organization (FAO) to include “the land under temporary agricultural crops (multiple-cropped areas are counted only once), temporary meadows for mowing or pasture, land under market and kitchen gardens and land temporarily fallow (less than  ve years).” Data for the percent of land that is arable and the square kilometers in a country are from the FAO.Contraceptive UseThe percentage of currently married or “in union” women of reproductive age who are currently using any form of contraception. Modern methods include clinic and supply methods such as the pill, IUD, condom, and sterilization. Data are from the most recently available national-level surveys, such as Demographic and Health Surveys, Reproductive Health Surveys, Multiple Indicator Cluster Surveys, regional survey programs, national surveys, and the UN Population Division World Contraceptive Use 2014. Data prior to 2009 are shown in italics.Life Expectancy at BirthThe average number of years a newborn infant can expect to live under current mortality rates. Maternal Deaths per 100,000 Births Maternal deaths in a time period divided by the number of live births in the same period, expressed per 100,000 live births. A maternal death is de ned by the World Health Organization (WHO) as “the death of a woman while pregnant or within 42 days of the termination of pregnancy, irrespective of the duration and site of the pregnancy, from any cause to or aggravated by the pregnancy or its management but not from accidental or incidental causes.” Data are from the 2014 report Trends in Maternal Mortality: 1990 to 2013 that compiles estimates by WHO, UNICEF, UNFPA, the World Bank, and the UN Population Division. HIV Prevalence The proportion of the population living with HIV regardless of the time of infection, knowledge of the infection, or stage of the disease. Data are from UNAIDS.Secondary School Enrollment RatioThe number of students enrolled in secondary education divided by the secondary-school-age population (Gross Enrollment Ratio). The ratio can be over 100 when there are students enrolled who are older or younger than the age expected for secondary school students. Data are from UNESCO for 2008-2014. Tertiary School Gender Parity IndexThe tertiary education gross enrollment ratio for women divided by the tertiary gross enrollment ratio for men. An index less than one indicates that men are more represented in higher education than women, while an index greater than one indicates that women are more represented. Data are from UNESCO for 2008-2014.Gender Ratio of Labor Force Participation RatesThe ratio of the female labor force participation rate over the male rate. The labor force participation rate is de ned as the proportion of the population ages 15 years and older who are economically active, including those employed and unemployed. A ratio less than one indicates that the male labor force participation rate is greater than the female rate while a ratio of more than one indicates that the female rate is greater than the male rate. Data are from the World Bank for 2013. Female Share of Nonagricultural Wage EarnersThe percent of workers in wage employment in the nonagricultural sector who are women. In a small number of countries the de nition of the sector is one of the following: the economically active population in nonagriculture, total employment, total employment in nonagriculture, total paid employment, and employment in the public sector. Data are from the UN from 2008-2013. Female Share of Parliament MembersThe percentage of seats in a country’s single chamber, combined higher and lower chambers of the national parliament, or other national legislature held by women. Data are from the Inter-Parliamentary Union from May 1, 2015. Acknowledgments, Notes, Sources, and De nitionsPOPULATION REFERENCE BUREAU people around the world about population, health, and the environment, and them to the well-being of current and future generations.1875 Connecticut Ave., NW, Suite 520, Washington, DC 20009 USAtel. 202-483-1100 • fax 202-328-3937 • e-mail: popref@prb.org • website: www.prb.org If you value PRB’s World Population Data Sheet and are among the tens of thousands of people who eagerly anticipate its publication each year, please consider making a contribution to PRB. Your donation will help ensure that PRB can maintain its commitment to keeping the as affordable as possible. Visit our website to donate now: www.prb.org.research to provide the most objective, accurate, that are easily understood by advocates, journalists, and decisionmakers alike.INNOVATIVE TOOLS.PRB creates interactive content to make data and research more how projections of U.S. child poverty and the viewer. INFLUENTIAL PUBLICATIONS.looks at gaps in key development indicators between urban and rural dwellers in many low- and middle-income countries. MULTIMEDIA.PRB has produced hundreds of cutting-edge video and audio presentations PRB’s website provides access to all of our content, including our respected Data Sheets, visualizations, and data and analysis on world issues ranging from gender to aging to family PRB empowers people—researchers, journalists, policymakers, and educators—to use information about population, health, and the environment to encourage action. Frequently, people have information but lack the skills and tools needed to communicate effectively to decisionmakers. PRB builds coalitions and conducts trainings to share techniques to inform policy. PRB strengthens the capacity of journalists from developing countries through seminars and study tours. We organized several study tours for journalists in to visit projects and the people they affect.POLICY COMMUNICATION TRAINING.In the past  ve years, PRB has trained more than 1,000 professionals in Asia, Africa, and Latin America to communicate data and research effectively. Each year, for example, we have sponsored two workshops with Kenya’s National Council for Population and Development, training local and regional policymakers, program managers, and advocates. PRB developed and coordinates the American Community Survey (ACS) Data Users Group to increase understanding of the value and utility of ACS data and to facilitate key ACS data issues and applications. This group connects ACS data users and helps them share information and materials through an online community forum, webinars, special sessions at professional meetings, and an annual conference.ADVANCEPRB works to ensure that policymakers worldwide rely on sound evidence, rather than anecdotal or and environmental policies. While the numbers of publications created or workshops conducted are one way to measure PRB’s work, the adoption of evidence-based policies, increased demand for health services, and active coalitions are better gauges of progress toward positive social change. PRB provides analysis for the KIDS COUNT Data Book, an annual report card on the well-being of children and families in the United States. The Data Book has helped promote the passage of several U.S. policies, including the State Children’s Health Insurance Program. DEMAND FOR HEALTH SERVICES.TV reporting in India by an alumna of PRB’s Women’s Edition training program led to the creation of health camps to care for pregnant women in the slums. Another led to the renewal of a family planning program that promoted birth spacing. East Africa Population, Health, and Environment Network to increase information sharing across the region. In the Lake Victoria Basin, PRB also provides technical assistance on integrated population, health, and environment development in the region. PRB’s 2015 World Population Data Sheetis available in English, French, and Spanish at www.prb.org. Also online:A customized Data Dashboard where users can view multiple indicators for regions or countries.A video focusing on what the data say about the state of women’s empowerment. An interactive world map illustrating key demographic variables by country and region.To order PRB publications (discounts available for bulk orders):Online at www.prb.org.E-mail: popref@prb.org.Call toll-free: 800-877-9881.Fax: 202-328-3937.Mail: 1875 Connecticut Ave., NW, Suite 520, Washington, DC 20009.Data prepared by PRB demographers Toshiko Kaneda and Kristin Bietsch.© August 2015. Population Reference Bureau.All rights reserved. ISSN 0085-8315Photo credit, cover: © Jörg Dickmann, goZOOMA Women Women Women Women Women Women Congo, Dem. Rep. Colombia India Ukraine Canada 9999 show percent in 2011show percent in 2014Financial Inclusion of Women ExpandsFinancial inclusion—making appropriate, affordable, and convenient  nancial services available to all people—is a global development priority. For women, access to savings, credit, and other services can help them gain more  nancial independence, better manage and leverage their resources, and build capital to support income-generating activities. A core measure of  nancial inclusion is whether an individual uses an account at a bank or other formal  nancial institution. In most countries, even many least developed ones, the share of women with such accounts has increased over the past few years. Gaps remain between men and women, but these have narrowed in many cases, and most developed countries show effective gender parity at high levels of usage. Rapid expansion of mobile money and other  nancial services available via mobile devices, particularly in Africa, provide a convenient way for both men and women to access such services. Women are currently using mobile more than other formal accounts in several African countries (see table).Source: World Bank, Global Findex Database. WORLD POPULATION HIGHLIGHTSFOCUS ON WOMEN’S EMPOWERMENT Large Purchases Jordan 01020304050607080100172018151832274753665737426574667583748488917177896479725617 KenyaEgyptPhilippinesPakistanJordanSenegalNigeria 20142010 2006 2002 1998 1994 1990 6441587140362113314313524780 Women 25-29Women 25+ Rates of Early Marriage Fall, Particularly Among Those Under 15 Early marriage (before age 18) undermines the rights and livelihood opportunities of adolescent girls by leaving them vulnerable to the health risks of early pregnancy and childbearing, and prematurely ending their schooling. Rates of early marriage have declined broadly in the past 20 years, particularly among girls who are under age 15. Part of the overall decline re ects improvements in girls’ access to education: As girls educational attainment improves, the proportion marrying early tends to fall. Better employment opportunities for women and girls arriage among rural migrants under age 15. The percentage of Bangladeshi girls married by age 18 has declined much more slowly as the youngest potential brides tend to postpone marriage by only a few years. The majority of Bangladeshi girls continue to marry before age 18. Women Post Uneven Gains in Household Decisionmaking PowerMarried women in many countries are increasingly likely to have a say in household decisions, but these gains do not necessarily apply to every type of decision. When women are included in decisions about household spending, more money tends to be spent for the bene t of women and children. And when women are able to make decisions about their health care, they are less vulnerable to preventable diseases. Progress in these areas has varied by country, and even in countries showing notable gains, many women still do not engage in all types of important decisions. For example, in Nepal, only 66 percent of women have a say about their own health care decisions. The same percentage of Zambian women have the opportunity to make decisions about large household purchases.Family Planning Needs Increasingly Met by Modern Methods, but More Progress Needed “Demand for family planning satis ed with modern methods” has emerged as a key indicator of contraceptive availability and use. The indicator measures the proportion of women who want to delay or limit childbearing and who are using modern methods of contraception. Family planning experts have urged countries to strive for meeting at least 75 percent of demand with modern methods. Over the past two decades, a signi cant number of less developed countries have seen increases in the share of demand satis ed with modern methods, but many countries remain far below the proposed 75 percent benchmark. They will need to accelerate progress over the coming decade so that increased contraceptive use can translate into improved maternal and child health, slower population growth, increased economic well-being, and environmental sustainability.U.S. Gender Gap in College Completion Eases; Earnings Gap Persists Educational attainment in the United States has risen substantially over the last four decades. Between 1970 and 2014, the share of men ages 25 and older with at least a college degree climbed from 14 percent to 32 percent, while the share of adult women with at least a college degree quadrupled from 8 percent to 32 percent. For ages 25 to 29 only, the share of women with a bachelor’s degree or higher actually started outpacing the share for men in 1991. But women still lag behind men in earnings. Among full-time, year-round workers ages 25 and older in 2013, women’s median earnings were about 79 percent of men’s, up from 71 percent in 1993 (see table). This gender earnings gap persists across all educational levels. For bachelor’s degree holders, one factor may be that women are less likely to get degrees in higher-earning  elds such as science and engineering. In 2013, among adults ages 25 and older with a bachelor’s degree, only 26 percent of women had a degree in science and engineering, compared with 44 percent of men. However, even among full-time, year-round workers with engineering degrees, women’s median earnings in 2011 were only 83 percent of men’s. Data points are for each corresponding survey year.Source: ICF International, Demographic and Health Surveys.Source: ICF International, Demographic and Health Surveys.Source: International, Demographic and Health Surveys.Source: Census Bureau: 1970 to 2002 March Current Population Survey; 2003 to 2014 Annual Social and Economic Supplement to the Current Population Survey; American Community Survey Brief 11-10 (Oct. 2012); and PRB analysis of data from the 2013 American Community Survey. Percent of Young Women Married by Age 15 (numbers in white) and Age 18 (numbers in black)Percent of Demand for Family Planning Satis ed by Modern Contraceptive MethodsPercent Who Have Completed College, by AgePercent of Currently Married Women Who Have a Say in Decisions About This Topic Percent Who Have Used an Account at a Formal Financial Institution 837673654941271718192021991–19922141992201120002011199–199420121992PeruEgyptEthiopiaBangladeshNiger4728472919167 2 3 3 Percent of Women Using Financial Services by Type, 2014 Mobile Financial Other Formal Financial Institution te d'Ivoire Tanzania Female-to-Male Median Earnings Ratio Among Full-Time Year-Round Workers1993High School Some College, No DegreeBachelor’s Degree Bachelor’s Degree or MoreRatios are expressed as a percent.Percent Who Agree That Husband Is Justi ed Beating Wife if She Leaves the House Without Informing HimAcceptance of Wife Beating Recedes Violence against women poses a serious challenge to women’s empowerment. Combating such violence often requires changing the attitudes and beliefs of both men and women. In fact, in some countries, substantial percentages of women actually agree that a husband has the right to beat a wife under certain circumstances. Many of these women believe a husband is justi ed in hitting a wife ries. For example, in 2013, 13 percent of Nigerian men and 25 percent of Nigerian women viewed a wife leaving home without telling the husband as justi cation for wife beating, down from 19 percent and 32 percent, respectively, in 2008. Zambia also showed notable drops for both men and women between 2007 and 2013-2014. Globally, however, there is still a long path to achieve zero global tolerance of this harmful practice. Source: ICF International, Demographic and Health Surveys. Women MOST POPULOUS COUNTRIES,2015 AND 2050COUNTRY, 2050POPULATION COUNTRY, 2015POPULATION COUNTRIESWITH THE HIGHEST AND LOWEST TOTAL FERTILITY RATESCongo, Dem. Rep. POPULATION CLOCK,2015MORE DEVELOPED LESS DEVELOPED 7,336,435,0001,254,199,0006,082,235,000Year145,973,00013,760,000132,213,000399,92637,700362,226278252Year57,052,00012,283,00044,769,000156,30633,652122,65410923Natural increase perYear88,921,0001,477,00087,444,000243,6204,047239,573169166Year5,351,00073,0005,278,00014,660 201 14,459 10 0.1 10 Korea, SouthTaiwanGreeceSingapore Worldwide average life expectancy in years—7.3$15,030Average global gross capita—$39,020 in more INFORM | EMPOWER | ADVANCE | www.prb.org POPULATION REFERENCE BUREAU2015 World Population Data Sheet with a special focus on women’s empowerment © 2015 Population Reference Bureau 2015 WORLD POPULATION DATA SHEET The authors gratefully acknowledge the valuable assistance of PRB senior consultant, Carl Haub; PRB staff members John May, Kelvin Pollard, Donna Clifton, Carolyn Lamere, Heather Randall, and Nicole LaGrone; PRB interns Heather Zaccaro, Adaeze Ezeofor, and Kimberly Rightor; and staff of the International Programs Center of the U.S. Census Bureau; the United Nations (UN) Population Division; and the Institut national d’etudes démographiques (INED), Paris, in the preparation of this year’s World Population Data Sheet.This publication is funded by the William and Flora Hewlett Foundation, the David and Lucile Packard Foundation, the U.S. Agency for Interna-tional Development (IDEA Project, No. AID-0AA-A-10-00009), and supporters. The contents are the responsibility of the Population Reference Bureau and do not necessarily re ect the views of USAID or the United States government.The Data Sheet lists all geopolitical entities with populations of 150,000 or more and all mem-bers of the UN. These include sovereign states, dependencies, overseas departments, and some territories whose status or boundaries may be undetermined or in dispute. More developedregions, following the UN classi cation, comprise all of Europe and North America, plus Australia, Japan, and New Zealand. All other regions and countries are classi ed as less developed. The least developed countries consist of 48 coun-tries with especially low incomes, high economic vulnerability, and poor human development indi-cators; 34 of these countries are in sub-Saharan Africa, 13 in Asia, and one in the Caribbean. The criteria and list of countries, as de ned by the UN, can be found at http://unohrlls.org/about-ldcs/.Sub-Saharan Africa: All countries of Africa except the northern African countries of Algeria, Egypt, Libya, Morocco, Sudan, Tunisia, and Western Sahara.World and Regional Totals: Regional population totals are independently rounded and include small countries or areas not shown. Regional and world rates and percentages are weighted averages of countries for which data are available. For most indicators, regional averages are shown when data or estimates are available for at least three-quarters of the region’s population. ForSecondary School Enrollment Ratios, HIV Prevalence Rates, and Female Share of Nonagricultural Wage Earn-ers, regional averages are shown when data or estimates are available for at least half of the region’s population.World Population Data Sheets from different years should not be used as a time seriesFluctuations in values from year to year often re ect revisions based on new data or estimates rather than actual changes in levels. Additional information on likely trends and consistent time series can be obtained from PRB, and are also available from UN and U.S. Census Bureau publi-cations and websites.The rates and  gures are primarily compiled from the following sources: of cial country statistical yearbooks, bulletins, and websites; the UN Demographic Yearbook, 2013; and Population and Vital Statistics Report of the UN Statistics Division; World Population Prospects: The 2015 Revision of the UN Population Division; and the International Data Base of the International Programs Center, U.S. Census Bureau. Other sources include recent demographic surveys such as the Demographic and Health Surveys, Multiple Indicator Cluster Surveys, special studies, and direct communication with demographers and statistical bureaus in the United States and abroad. Speci c data sources may be obtained by contacting the authors of the 2015 World Population Data Sheet. For countries with complete registration of births and deaths, rates are those most recently reported. For more developed countries, nearly all vital rates refer to 2014 or 2013.Mid-2015 PopulationEstimates are based on a recent census, of cial national data, or PRB, UN, and U.S. Census Bureau projections. The effects of refugee movements, large numbers of foreign workers, and population shifts due to contemporary political events are taken into account to the extent possible.Birth and Death RateThe annual number of births and deaths per 1,000 total population. These rates are often referred to as “crude rates” since they do not take a population’s age structure into account. Thus, crude death rates in more developed countries with a relatively large proportion of high-mortality older population are often higher than those in less developed countries with lower life expectancy.Net MigrationThe estimated rate of net immigration (immigration minus emigration) per 1,000 population for a recent year based upon the of cial national rate or derived as a residual from estimated birth, death, and population growth rates. Migration rates can vary substantially from year to year for any particular country, as can the de nition of an immigrant.Projected Population, 2030 and 2050Projected populations based on reasonable assumptions on the future course of fertility, mortality, and migration. Projections are based on of cial country projections, series issued by the UN or the U.S. Census Bureau, or PRB projections.Infant Mortality RateThe annual number of deaths of infants under age 1 per 1,000 live births. Rates shown with decimals indicate national statistics reported as completely registered, while those without are estimates from the sources cited above. Rates shown in italics are based upon fewer than 50 annual infant deaths and, as a result, are subject to considerable yearly variability; rates shown for such countries are averages for a multiple-year period. Total Fertility Rate (TFR)The average number of children a woman would have assuming that current age-speci c birth rates remain constant throughout her childbearing years (usually considered to be ages 15 to 49).Population Under Age 15/Age 65+The percentage of the total population in those ages, which are often considered the “dependent ages.” GNI PPP per Capita, 2014 (US$)GNI PPP per capita is gross national income in purchasing power parity (PPP) divided by mid-year population. GNI PPP refers to gross national income converted to “international” dollars using a purchasing power parity conversion factor. PPP adjusts exchange rates to relative purchasing power in different countries, providing a more ac-curate basis of comparison for GNI. Data are from the World Bank. Figures in italics are for 2013, 2012, or 2011.Percent UrbanPercentage of the total population living in areas termed “urban” by that country or by the UN. Countries de ne urban in many different ways, from population centers of 100 or more dwellings to only the population living in national and provincial capitals.Population per Square Kilometer of Arable LandThe mid-year 2015 population divided by the square kilometers of arable land. Arable land is de ned by the UN Food and Agriculture Organization (FAO) to include “the land under temporary agricultural crops (multiple-cropped areas are counted only once), temporary meadows for mowing or pasture, land under market and kitchen gardens and land temporarily fallow (less than  ve years).” Data for the percent of land that is arable and the square kilometers in a country are from the FAO.Contraceptive UseThe percentage of currently married or “in union” women of reproductive age who are currently using any form of contraception. Modern methods include clinic and supply methods such as the pill, IUD, condom, and sterilization. Data are from the most recently available national-level surveys, such as Demographic and Health Surveys, Reproductive Health Surveys, Multiple Indicator Cluster Surveys, regional survey programs, national surveys, and the UN Population Division World Contraceptive Use 2014. Data prior to 2009 are shown in italics.Life Expectancy at BirthThe average number of years a newborn infant can expect to live under current mortality rates. Maternal Deaths per 100,000 Births Maternal deaths in a time period divided by the number of live births in the same period, expressed per 100,000 live births. A maternal death is de ned by the World Health Organization (WHO) as “the death of a woman while pregnant or within 42 days of the termination of pregnancy, irrespective of the duration and site of the pregnancy, from any cause to or aggravated by the pregnancy or its management but not from accidental or incidental causes.” Data are from the 2014 report Trends in Maternal Mortality: 1990 to 2013 that compiles estimates by WHO, UNICEF, UNFPA, the World Bank, and the UN Population Division. HIV Prevalence The proportion of the population living with HIV regardless of the time of infection, knowledge of the infection, or stage of the disease. Data are from UNAIDS.Secondary School Enrollment RatioThe number of students enrolled in secondary education divided by the secondary-school-age population (Gross Enrollment Ratio). The ratio can be over 100 when there are students enrolled who are older or younger than the age expected for secondary school students. Data are from UNESCO for 2008-2014. Tertiary School Gender Parity IndexThe tertiary education gross enrollment ratio for women divided by the tertiary gross enrollment ratio for men. An index less than one indicates that men are more represented in higher education than women, while an index greater than one indicates that women are more represented. Data are from UNESCO for 2008-2014.Gender Ratio of Labor Force Participation RatesThe ratio of the female labor force participation rate over the male rate. The labor force participation rate is de ned as the proportion of the population ages 15 years and older who are economically active, including those employed and unemployed. A ratio less than one indicates that the male labor force participation rate is greater than the female rate while a ratio of more than one indicates that the female rate is greater than the male rate. Data are from the World Bank for 2013. Female Share of Nonagricultural Wage EarnersThe percent of workers in wage employment in the nonagricultural sector who are women. In a small number of countries the de nition of the sector is one of the following: the economically active population in nonagriculture, total employment, total employment in nonagriculture, total paid employment, and employment in the public sector. Data are from the UN from 2008-2013. Female Share of Parliament MembersThe percentage of seats in a country’s single chamber, combined higher and lower chambers of the national parliament, or other national legislature held by women. Data are from the Inter-Parliamentary Union from May 1, 2015. Acknowledgments, Notes, Sources, and De nitionsPOPULATION REFERENCE BUREAU people around the world about population, health, and the environment, and them to the well-being of current and future generations.1875 Connecticut Ave., NW, Suite 520, Washington, DC 20009 USAtel. 202-483-1100 • fax 202-328-3937 • e-mail: popref@prb.org • website: www.prb.org If you value PRB’s World Population Data Sheet and are among the tens of thousands of people who eagerly anticipate its publication each year, please consider making a contribution to PRB. Your donation will help ensure that PRB can maintain its commitment to keeping the as affordable as possible. Visit our website to donate now: www.prb.org.research to provide the most objective, accurate, that are easily understood by advocates, journalists, and decisionmakers alike.INNOVATIVE TOOLS.PRB creates interactive content to make data and research more how projections of U.S. child poverty and the viewer. INFLUENTIAL PUBLICATIONS.looks at gaps in key development indicators between urban and rural dwellers in many low- and middle-income countries. MULTIMEDIA.PRB has produced hundreds of cutting-edge video and audio presentations PRB’s website provides access to all of our content, including our respected Data Sheets, visualizations, and data and analysis on world issues ranging from gender to aging to family PRB empowers people—researchers, journalists, policymakers, and educators—to use information about population, health, and the environment to encourage action. Frequently, people have information but lack the skills and tools needed to communicate effectively to decisionmakers. PRB builds coalitions and conducts trainings to share techniques to inform policy. PRB strengthens the capacity of journalists from developing countries through seminars and study tours. We organized several study tours for journalists in to visit projects and the people they affect.POLICY COMMUNICATION TRAINING.In the past  ve years, PRB has trained more than 1,000 professionals in Asia, Africa, and Latin America to communicate data and research effectively. Each year, for example, we have sponsored two workshops with Kenya’s National Council for Population and Development, training local and regional policymakers, program managers, and advocates. PRB developed and coordinates the American Community Survey (ACS) Data Users Group to increase understanding of the value and utility of ACS data and to facilitate key ACS data issues and applications. This group connects ACS data users and helps them share information and materials through an online community forum, webinars, special sessions at professional meetings, and an annual conference.ADVANCEPRB works to ensure that policymakers worldwide rely on sound evidence, rather than anecdotal or and environmental policies. While the numbers of publications created or workshops conducted are one way to measure PRB’s work, the adoption of evidence-based policies, increased demand for health services, and active coalitions are better gauges of progress toward positive social change. PRB provides analysis for the KIDS COUNT Data Book, an annual report card on the well-being of children and families in the United States. The Data Book has helped promote the passage of several U.S. policies, including the State Children’s Health Insurance Program. DEMAND FOR HEALTH SERVICES.TV reporting in India by an alumna of PRB’s Women’s Edition training program led to the creation of health camps to care for pregnant women in the slums. Another led to the renewal of a family planning program that promoted birth spacing. East Africa Population, Health, and Environment Network to increase information sharing across the region. In the Lake Victoria Basin, PRB also provides technical assistance on integrated population, health, and environment development in the region. PRB’s 2015 World Population Data Sheetis available in English, French, and Spanish at www.prb.org. Also online:A customized Data Dashboard where users can view multiple indicators for regions or countries.A video focusing on what the data say about the state of women’s empowerment. An interactive world map illustrating key demographic variables by country and region.To order PRB publications (discounts available for bulk orders):Online at www.prb.org.E-mail: popref@prb.org.Call toll-free: 800-877-9881.Fax: 202-328-3937.Mail: 1875 Connecticut Ave., NW, Suite 520, Washington, DC 20009.Data prepared by PRB demographers Toshiko Kaneda and Kristin Bietsch.© August 2015. Population Reference Bureau.All rights reserved. ISSN 0085-8315Photo credit, cover: © Jörg Dickmann, goZOOMA WomenWomenWomenWomenWomenWomenshow percent in 2011show percent in 2014 Financial Inclusion of Women ExpandsFinancial inclusion—making appropriate, affordable, and convenient  nancial services available to all people—is a global development priority. For women, access to savings, credit, and other services can help them gain more  nancial independence, better manage and leverage their resources, and build capital to support income-generating activities. A core measure of  nancial inclusion is whether an individual uses an account at a bank or other formal  nancial institution. In most countries, even many least developed ones, the share of women with such accounts has increased over the past few years. Gaps remain between men and women, but these have narrowed in many cases, and most developed countries show effective gender parity at high levels of usage. Rapid expansion of mobile money and other  nancial services available via mobile devices, particularly in Africa, provide a convenient way for both men and women to access such services. Women are currently using mobile more than other formal accounts in several African countries (see table).Source: World Bank, Global Findex Database. WORLD POPULATION HIGHLIGHTSFOCUS ON WOMEN’S EMPOWERMENT Large Purchases Jordan 01020304050607080100172018151832274753665737426574667583748488917177896479725617 KenyaEgyptPhilippinesPakistanJordanSenegalNigeria 20142010 2006 2002 1998 1994 1990 6441587140362113314313524780 05 10 201420102006200219981994199019861982197819741970 Women 25-29Women 25+ Rates of Early Marriage Fall, Particularly Among Those Under 15 Early marriage (before age 18) undermines the rights and livelihood opportunities of adolescent girls by leaving them vulnerable to the health risks of early pregnancy and childbearing, and prematurely ending their schooling. Rates of early marriage have declined broadly in the past 20 years, particularly among girls who are under age 15. Part of the overall decline re ects improvements in girls’ access to education: As girls educational attainment improves, the proportion marrying early tends to fall. Better employment opportunities for women and girls arriage among rural migrants under age 15. The percentage of Bangladeshi girls married by age 18 has declined much more slowly as the youngest potential brides tend to postpone marriage by only a few years. The majority of Bangladeshi girls continue to marry before age 18. Women Post Uneven Gains in Household Decisionmaking PowerMarried women in many countries are increasingly likely to have a say in household decisions, but these gains do not necessarily apply to every type of decision. When women are included in decisions about household spending, more money tends to be spent for the bene t of women and children. And when women are able to make decisions about their health care, they are less vulnerable to preventable diseases. Progress in these areas has varied by country, and even in countries showing notable gains, many women still do not engage in all types of important decisions. For example, in Nepal, only 66 percent of women have a say about their own health care decisions. The same percentage of Zambian women have the opportunity to make decisions about large household purchases.Family Planning Needs Increasingly Met by Modern Methods, but More Progress Needed “Demand for family planning satis ed with modern methods” has emerged as a key indicator of contraceptive availability and use. The indicator measures the proportion of women who want to delay or limit childbearing and who are using modern methods of contraception. Family planning experts have urged countries to strive for meeting at least 75 percent of demand with modern methods. Over the past two decades, a signi cant number of less developed countries have seen increases in the share of demand satis ed with modern methods, but many countries remain far below the proposed 75 percent benchmark. They will need to accelerate progress over the coming decade so that increased contraceptive use can translate into improved maternal and child health, slower population growth, increased economic well-being, and environmental sustainability. U.S. Gender Gap in College Completion Eases; Earnings Gap Persists Educational attainment in the United States has risen substantially over the last four decades. Between 1970 and 2014, the share of men ages 25 and older with at least a college degree climbed from 14 percent to 32 percent, while the share of adult women with at least a college degree quadrupled from 8 percent to 32 percent. For ages 25 to 29 only, the share of women with a bachelor’s degree or higher actually started outpacing the share for men in 1991. But women still lag behind men in earnings. Among full-time, year-round workers ages 25 and older in 2013, women’s median earnings were about 79 percent of men’s, up from 71 percent in 1993 (see table). This gender earnings gap persists across all educational levels. For bachelor’s degree holders, one factor may be that women are less likely to get degrees in higher-earning  elds such as science and engineering. In 2013, among adults ages 25 and older with a bachelor’s degree, only 26 percent of women had a degree in science and engineering, compared with 44 percent of men. However, even among full-time, year-round workers with engineering degrees, women’s median earnings in 2011 were only 83 percent of men’s. Data points are for each corresponding survey year.Source: ICF International, Demographic and Health Surveys.Source: ICF International, Demographic and Health Surveys.Source: International, Demographic and Health Surveys. Source: Census Bureau: 1970 to 2002 March Current Population Survey; 2003 to 2014 Annual Social and Economic Supplement to the Current Population Survey; American Community Survey Brief 11-10 (Oct. 2012); and PRB analysis of data from the 2013 American Community Survey. Percent of Young Women Married by Age 15 (numbers in white) and Age 18 (numbers in black)Percent of Demand for Family Planning Satis ed by Modern Contraceptive Methods Percent Who Have Completed College, by Age Percent of Currently Married Women Who Have a Say in Decisions About This TopicPercent Who Have Used an Account at a Formal Financial Institution 837673654941271718192021991–19922141992201120002011199–199420121992PeruEgyptEthiopiaBangladeshNiger4728472919167 2 3 3 Percent of Women Using Financial Services by Type, 2014 Mobile Financial Other Formal Financial Institution te d'Ivoire Tanzania Female-to-Male Median Earnings Ratio Among Full-Time Year-Round Workers1993High School Some College, No DegreeBachelor’s Degree Bachelor’s Degree or MoreRatios are expressed as a percent. Percent Who Agree That Husband Is Justi ed Beating Wife if She Leaves the House Without Informing HimAcceptance of Wife Beating Recedes Violence against women poses a serious challenge to women’s empowerment. Combating such violence often requires changing the attitudes and beliefs of both men and women. In fact, in some countries, substantial percentages of women actually agree that a husband has the right to beat a wife under certain circumstances. Many of these women believe a husband is justi ed in hitting a wife ries. For example, in 2013, 13 percent of Nigerian men and 25 percent of Nigerian women viewed a wife leaving home without telling the husband as justi cation for wife beating, down from 19 percent and 32 percent, respectively, in 2008. Zambia also showed notable drops for both men and women between 2007 and 2013-2014. Globally, however, there is still a long path to achieve zero global tolerance of this harmful practice. Source: ICF International, Demographic and Health Surveys. Women MOST POPULOUS COUNTRIES,2015 AND 2050COUNTRY, 2050POPULATION COUNTRY, 2015POPULATION COUNTRIESWITH THE HIGHEST AND LOWEST TOTAL FERTILITY RATESCongo, Dem. Rep. POPULATION CLOCK,2015MORE DEVELOPED LESS DEVELOPED 7,336,435,0001,254,199,0006,082,235,000Year145,973,00013,760,000132,213,000399,92637,700362,226278252Year57,052,00012,283,00044,769,000156,30633,652122,65410923Natural increase perYear88,921,0001,477,00087,444,000243,6204,047239,573169166Year5,351,00073,0005,278,00014,660 201 14,459 10 0.1 10 Korea, SouthTaiwanGreeceSingapore Worldwide average life expectancy in years—7.3$15,030Average global gross capita—$39,020 in more INFORM | EMPOWER | ADVANCE | www.prb.org POPULATION REFERENCE BUREAU2015 World Population Data Sheet with a special focus on women’s empowerment © 2015 Population Reference Bureau 2015 WORLD POPULATION DATA SHEET 12 Infant mortality rate per 1,000 live births in Kosovo, the highest rate in Europe. Population per square kilometer of arable land in South Korea. 9.8Projected 2050 world population, up 2.5 billion The percentage of married women ages 15-49 in Peru who use modern contraception. 15.5%The percentage of women in Swaziland ages 15-24 infected with HIV/AIDS, vs. 7.2% for men in same age group. 58% The percentage of Rwanda’s parliament members who are women—the world’s highest percentage. The number of maternal mortality deaths per 100,000 live births in the United States, up from 12 in 1990. 4.4The total fertility rate (lifetime births per woman) in Yemen. © 2015 Population Reference Bureau See notes on page 212015 WORLD POPULATION DATA SHEET POPULATION, HEALTH, AND ENVIRONMENT DATA AND ESTIMATES FOR THE COUNTRIES AND REGIONS OF THE WORLD © 2015 Population Reference Bureau See notes on page 212015 WORLD POPULATION DATA SHEET POPULATION, HEALTH, AND ENVIRONMENT DATA AND ESTIMATES FOR THE COUNTRIES AND REGIONS OF THE WORLD PopulationPopulationPopulationPopulationInfant Total Fertility Percent of Population Percent Population Percent of Married Women 15-49 Using Life Expectancy Percent Ages Secondary SchoolTertiary Parity IndexParticipation Rates Female Share of Wage EarnersFemale Share of Parliament SexesFemalesFemales Females NORTHERN AFRICA MoroccoTunisiaWestern SaharaCape VerdeCôte d’Ivoire TogoComorosEritrea Tanzania CameroonSao Tome and Principe NORTHERN AMERICALATIN AMERICA AND THE CARIBBEAN Grenada St. Vincent and the GrenadinesTrinidad and TobagoArgentina French GuianaVenezuelaArmenia GeorgiaJordanPalestinian TerritoryTurkey YemenKyrgyzstanTajikistanTurkmenistan Singapore Timor-LesteViet NamKorea, NorthKorea, SouthTaiwan NORTHERN EUROPEIreland GermanyLuxembourg CroatiaGreece MontenegroFederated States of MicronesiaFrench Polynesia TongaTuvaluVanuatuPopulation PopulationPopulationMigration Total FertilityPercent Population of Arable Land FemalesFemalesFemales PopulationPercent of PopulationPercent of Married Women ContraceptionMaternal Deaths per Percent Ages 15-24 Tertiary School Gender Parity of Labor Force Participation RatesFemale Share of Nonagricultural Wage EarnersFemale Share of Parliament © 2015 Population Reference Bureau See notes on page 212015 WORLD POPULATION DATA SHEET POPULATION, HEALTH, AND ENVIRONMENT DATA AND ESTIMATES FOR THE COUNTRIES AND REGIONS OF THE WORLD PopulationPopulationPopulationPopulationInfant Total Fertility Percent of Population Percent Population Percent of Married Women 15-49 Using Life Expectancy Percent Ages Secondary SchoolTertiary Parity IndexParticipation Rates Female Share of Wage EarnersFemale Share of Parliament SexesFemalesFemales Females NORTHERN AFRICA MoroccoTunisiaWestern SaharaCape VerdeCôte d’Ivoire TogoComorosEritrea Tanzania CameroonSao Tome and Principe NORTHERN AMERICALATIN AMERICA AND THE CARIBBEAN Grenada St. Vincent and the GrenadinesTrinidad and TobagoArgentina French GuianaVenezuelaArmenia GeorgiaJordanPalestinian TerritoryTurkey YemenKyrgyzstanTajikistanTurkmenistan Singapore Timor-LesteViet NamKorea, NorthKorea, SouthTaiwan NORTHERN EUROPEIreland GermanyLuxembourg CroatiaGreece MontenegroFederated States of MicronesiaFrench Polynesia TongaTuvaluVanuatuPopulation PopulationPopulationMigration Total FertilityPercent Population of Arable Land FemalesFemalesFemales PopulationPercent of PopulationPercent of Married Women ContraceptionMaternal Deaths per Percent Ages 15-24 Tertiary School Gender Parity of Labor Force Participation RatesFemale Share of Nonagricultural Wage EarnersFemale Share of Parliament © 2015 Population Reference Bureau See notes on page 212015 WORLD POPULATION DATA SHEET POPULATION, HEALTH, AND ENVIRONMENT DATA AND ESTIMATES FOR THE COUNTRIES AND REGIONS OF THE WORLD PopulationPopulationPopulationPopulationInfant Total Fertility Percent of Population Percent Population Percent of Married Women 15-49 Using Life Expectancy Percent Ages Secondary SchoolTertiary Parity IndexParticipation Rates Female Share of Wage EarnersFemale Share of Parliament SexesFemalesFemales Females NORTHERN AFRICA MoroccoTunisiaWestern SaharaCape VerdeCôte d’Ivoire TogoComorosEritrea Tanzania CameroonSao Tome and Principe NORTHERN AMERICALATIN AMERICA AND THE CARIBBEAN Grenada St. Vincent and the GrenadinesTrinidad and TobagoArgentina French GuianaVenezuelaArmenia GeorgiaJordanPalestinian TerritoryTurkey YemenKyrgyzstanTajikistanTurkmenistan Singapore Timor-LesteViet NamKorea, NorthKorea, SouthTaiwan NORTHERN EUROPEIreland GermanyLuxembourg CroatiaGreece MontenegroFederated States of MicronesiaFrench Polynesia TongaTuvaluVanuatuPopulation PopulationPopulationMigration Total FertilityPercent Population of Arable Land FemalesFemalesFemales PopulationPercent of PopulationPercent of Married Women ContraceptionMaternal Deaths per Percent Ages 15-24 Tertiary School Gender Parity of Labor Force Participation RatesFemale Share of Nonagricultural Wage EarnersFemale Share of Parliament © 2015 Population Reference Bureau See notes on page 212015 WORLD POPULATION DATA SHEET POPULATION, HEALTH, AND ENVIRONMENT DATA AND ESTIMATES FOR THE COUNTRIES AND REGIONS OF THE WORLD PopulationPopulationPopulationPopulationInfant Total Fertility Percent of Population Percent Population Percent of Married Women 15-49 Using Life Expectancy Percent Ages Secondary SchoolTertiary Parity IndexParticipation Rates Female Share of Wage EarnersFemale Share of Parliament SexesFemalesFemales Females NORTHERN AFRICA MoroccoTunisiaWestern SaharaCape VerdeCôte d’Ivoire TogoComorosEritrea Tanzania CameroonSao Tome and Principe NORTHERN AMERICALATIN AMERICA AND THE CARIBBEAN Grenada St. Vincent and the GrenadinesTrinidad and TobagoArgentina French GuianaVenezuelaArmenia GeorgiaJordanPalestinian TerritoryTurkey YemenKyrgyzstanTajikistanTurkmenistan Singapore Timor-LesteViet NamKorea, NorthKorea, SouthTaiwan NORTHERN EUROPEIreland GermanyLuxembourg CroatiaGreece MontenegroFederated States of MicronesiaFrench Polynesia TongaTuvaluVanuatuPopulation PopulationPopulationMigration Total FertilityPercent Population of Arable Land FemalesFemalesFemales PopulationPercent of PopulationPercent of Married Women ContraceptionMaternal Deaths per Percent Ages 15-24 Tertiary School Gender Parity of Labor Force Participation RatesFemale Share of Nonagricultural Wage EarnersFemale Share of Parliament © 2015 Population Reference Bureau See notes on page 212015 WORLD POPULATION DATA SHEET POPULATION, HEALTH, AND ENVIRONMENT DATA AND ESTIMATES FOR THE COUNTRIES AND REGIONS OF THE WORLD © 2015 Population Reference Bureau See notes on page 212015 WORLD POPULATION DATA SHEET POPULATION, HEALTH, AND ENVIRONMENT DATA AND ESTIMATES FOR THE COUNTRIES AND REGIONS OF THE WORLD PopulationPopulationPopulationPopulationInfant Total Fertility Percent of Population Percent Population Percent of Married Women 15-49 Using Life Expectancy Percent Ages Secondary SchoolTertiary Parity IndexParticipation Rates Female Share of Wage EarnersFemale Share of Parliament SexesFemalesFemales Females NORTHERN AFRICA MoroccoTunisiaWestern SaharaCape VerdeCôte d’Ivoire TogoComorosEritrea Tanzania CameroonSao Tome and Principe NORTHERN AMERICALATIN AMERICA AND THE CARIBBEAN Grenada St. Vincent and the GrenadinesTrinidad and TobagoArgentina French GuianaVenezuelaArmenia GeorgiaJordanPalestinian TerritoryTurkey YemenKyrgyzstanTajikistanTurkmenistan Singapore Timor-LesteViet NamKorea, NorthKorea, SouthTaiwan NORTHERN EUROPEIreland GermanyLuxembourg CroatiaGreece MontenegroFederated States of MicronesiaFrench Polynesia TongaTuvaluVanuatuPopulation PopulationPopulationMigration Total FertilityPercent Population of Arable Land FemalesFemalesFemales PopulationPercent of PopulationPercent of Married Women ContraceptionMaternal Deaths per Percent Ages 15-24 Tertiary School Gender Parity of Labor Force Participation RatesFemale Share of Nonagricultural Wage EarnersFemale Share of Parliament PopulationPopulationPopulationPopulationInfant Total Fertility Percent of Population Percent Population Percent of Married Women 15-49 Using Life Expectancy Percent Ages Secondary SchoolTertiary Parity IndexParticipation Rates Female Share of Wage EarnersFemale Share of Parliament SexesFemalesFemales Females NORTHERN AFRICA MoroccoTunisiaWestern SaharaCape VerdeCôte d’Ivoire TogoComorosEritrea Tanzania CameroonSao Tome and Principe NORTHERN AMERICALATIN AMERICA AND THE CARIBBEAN Grenada St. Vincent and the GrenadinesTrinidad and TobagoArgentina French GuianaVenezuelaArmenia GeorgiaJordanPalestinian TerritoryTurkey YemenKyrgyzstanTajikistanTurkmenistan Singapore Timor-LesteViet NamKorea, NorthKorea, SouthTaiwan NORTHERN EUROPEIreland GermanyLuxembourg CroatiaGreece MontenegroFederated States of MicronesiaFrench Polynesia TongaTuvaluVanuatuPopulation PopulationPopulationMigration Total FertilityPercent Population of Arable Land FemalesFemalesFemales PopulationPercent of PopulationPercent of Married Women ContraceptionMaternal Deaths per Percent Ages 15-24 Tertiary School Gender Parity of Labor Force Participation RatesFemale Share of Nonagricultural Wage EarnersFemale Share of Parliament © 2015 Population Reference Bureau See notes on page 212015 WORLD POPULATION DATA SHEET POPULATION, HEALTH, AND ENVIRONMENT DATA AND ESTIMATES FOR THE COUNTRIES AND REGIONS OF THE WORLD PopulationPopulationPopulationPopulationInfant Total Fertility Percent of Population Percent Population Percent of Married Women 15-49 Using Life Expectancy Percent Ages Secondary SchoolTertiary Parity IndexParticipation Rates Female Share of Wage EarnersFemale Share of Parliament SexesFemalesFemales Females NORTHERN AFRICA MoroccoTunisiaWestern SaharaCape VerdeCôte d’Ivoire TogoComorosEritrea Tanzania CameroonSao Tome and Principe NORTHERN AMERICALATIN AMERICA AND THE CARIBBEAN Grenada St. Vincent and the GrenadinesTrinidad and TobagoArgentina French GuianaVenezuelaArmenia GeorgiaJordanPalestinian TerritoryTurkey YemenKyrgyzstanTajikistanTurkmenistan Singapore Timor-LesteViet NamKorea, NorthKorea, SouthTaiwan NORTHERN EUROPEIreland GermanyLuxembourg CroatiaGreece MontenegroFederated States of MicronesiaFrench Polynesia TongaTuvaluVanuatuPopulation PopulationPopulationMigration Total FertilityPercent Population of Arable Land FemalesFemalesFemales PopulationPercent of PopulationPercent of Married Women ContraceptionMaternal Deaths per Percent Ages 15-24 Tertiary School Gender Parity of Labor Force Participation RatesFemale Share of Nonagricultural Wage EarnersFemale Share of Parliament PopulationPopulationPopulationPopulationInfant Total Fertility Percent of Population Percent Population Percent of Married Women 15-49 Using Life Expectancy Percent Ages Secondary SchoolTertiary Parity IndexParticipation Rates Female Share of Wage EarnersFemale Share of Parliament SexesFemalesFemales Females NORTHERN AFRICA MoroccoTunisiaWestern SaharaCape VerdeCôte d’Ivoire TogoComorosEritrea Tanzania CameroonSao Tome and Principe NORTHERN AMERICALATIN AMERICA AND THE CARIBBEAN Grenada St. Vincent and the GrenadinesTrinidad and TobagoArgentina French GuianaVenezuelaArmenia GeorgiaJordanPalestinian TerritoryTurkey YemenKyrgyzstanTajikistanTurkmenistan Singapore Timor-LesteViet NamKorea, NorthKorea, SouthTaiwan NORTHERN EUROPEIreland GermanyLuxembourg CroatiaGreece MontenegroFederated States of MicronesiaFrench Polynesia TongaTuvaluVanuatuPopulation PopulationPopulationMigration Total FertilityPercent Population of Arable Land FemalesFemalesFemales PopulationPercent of PopulationPercent of Married Women ContraceptionMaternal Deaths per Percent Ages 15-24 Tertiary School Gender Parity of Labor Force Participation RatesFemale Share of Nonagricultural Wage EarnersFemale Share of Parliament © 2015 Population Reference Bureau See notes on page 212015 WORLD POPULATION DATA SHEET POPULATION, HEALTH, AND ENVIRONMENT DATA AND ESTIMATES FOR THE COUNTRIES AND REGIONS OF THE WORLD PopulationPopulationPopulationPopulationInfant Total Fertility Percent of Population Percent Population Percent of Married Women 15-49 Using Life Expectancy Percent Ages Secondary SchoolTertiary Parity IndexParticipation Rates Female Share of Wage EarnersFemale Share of Parliament SexesFemalesFemales Females NORTHERN AFRICA MoroccoTunisiaWestern SaharaCape VerdeCôte d’Ivoire TogoComorosEritrea Tanzania CameroonSao Tome and Principe NORTHERN AMERICALATIN AMERICA AND THE CARIBBEAN Grenada St. Vincent and the GrenadinesTrinidad and TobagoArgentina French GuianaVenezuelaArmenia GeorgiaJordanPalestinian TerritoryTurkey YemenKyrgyzstanTajikistanTurkmenistan Singapore Timor-LesteViet NamKorea, NorthKorea, SouthTaiwan NORTHERN EUROPEIreland GermanyLuxembourg CroatiaGreece MontenegroFederated States of MicronesiaFrench Polynesia TongaTuvaluVanuatuPopulation PopulationPopulationMigration Total FertilityPercent Population of Arable Land FemalesFemalesFemales PopulationPercent of PopulationPercent of Married Women ContraceptionMaternal Deaths per Percent Ages 15-24 Tertiary School Gender Parity of Labor Force Participation RatesFemale Share of Nonagricultural Wage EarnersFemale Share of Parliament PopulationPopulationPopulationPopulationInfant Total Fertility Percent of Population Percent Population Percent of Married Women 15-49 Using Life Expectancy Percent Ages Secondary SchoolTertiary Parity IndexParticipation Rates Female Share of Wage EarnersFemale Share of Parliament SexesFemalesFemales Females NORTHERN AFRICA MoroccoTunisiaWestern SaharaCape VerdeCôte d’Ivoire TogoComorosEritrea Tanzania CameroonSao Tome and Principe NORTHERN AMERICALATIN AMERICA AND THE CARIBBEAN Grenada St. Vincent and the GrenadinesTrinidad and TobagoArgentina French GuianaVenezuelaArmenia GeorgiaJordanPalestinian TerritoryTurkey YemenKyrgyzstanTajikistanTurkmenistan Singapore Timor-LesteViet NamKorea, NorthKorea, SouthTaiwan NORTHERN EUROPEIreland GermanyLuxembourg CroatiaGreece MontenegroFederated States of MicronesiaFrench Polynesia TongaTuvaluVanuatuPopulation PopulationPopulationMigration Total FertilityPercent Population of Arable Land FemalesFemalesFemales PopulationPercent of PopulationPercent of Married Women ContraceptionMaternal Deaths per Percent Ages 15-24 Tertiary School Gender Parity of Labor Force Participation RatesFemale Share of Nonagricultural Wage EarnersFemale Share of Parliament © 2015 Population Reference Bureau See notes on page 212015 WORLD POPULATION DATA SHEET POPULATION, HEALTH, AND ENVIRONMENT DATA AND ESTIMATES FOR THE COUNTRIES AND REGIONS OF THE WORLD PopulationPopulationPopulationPopulationInfant Total Fertility Percent of Population Percent Population Percent of Married Women 15-49 Using Life Expectancy Percent Ages Secondary SchoolTertiary Parity IndexParticipation Rates Female Share of Wage EarnersFemale Share of Parliament SexesFemalesFemales Females NORTHERN AFRICA MoroccoTunisiaWestern SaharaCape VerdeCôte d’Ivoire TogoComorosEritrea Tanzania CameroonSao Tome and Principe NORTHERN AMERICALATIN AMERICA AND THE CARIBBEAN Grenada St. Vincent and the GrenadinesTrinidad and TobagoArgentina French GuianaVenezuelaArmenia GeorgiaJordanPalestinian TerritoryTurkey YemenKyrgyzstanTajikistanTurkmenistan Singapore Timor-LesteViet NamKorea, NorthKorea, SouthTaiwan NORTHERN EUROPEIreland GermanyLuxembourg CroatiaGreece MontenegroFederated States of MicronesiaFrench Polynesia TongaTuvaluVanuatuPopulation PopulationPopulationMigration Total FertilityPercent Population of Arable Land FemalesFemalesFemales PopulationPercent of PopulationPercent of Married Women ContraceptionMaternal Deaths per Percent Ages 15-24 Tertiary School Gender Parity of Labor Force Participation RatesFemale Share of Nonagricultural Wage EarnersFemale Share of Parliament PopulationPopulationPopulationPopulationInfant Total Fertility Percent of Population Percent Population Percent of Married Women 15-49 Using Life Expectancy Percent Ages Secondary SchoolTertiary Parity IndexParticipation Rates Female Share of Wage EarnersFemale Share of Parliament SexesFemalesFemales Females NORTHERN AFRICA MoroccoTunisiaWestern SaharaCape VerdeCôte d’Ivoire TogoComorosEritrea Tanzania CameroonSao Tome and Principe NORTHERN AMERICALATIN AMERICA AND THE CARIBBEAN Grenada St. Vincent and the GrenadinesTrinidad and TobagoArgentina French GuianaVenezuelaArmenia GeorgiaJordanPalestinian TerritoryTurkey YemenKyrgyzstanTajikistanTurkmenistan Singapore Timor-LesteViet NamKorea, NorthKorea, SouthTaiwan NORTHERN EUROPEIreland GermanyLuxembourg CroatiaGreece MontenegroFederated States of MicronesiaFrench Polynesia TongaTuvaluVanuatuPopulation PopulationPopulationMigration Total FertilityPercent Population of Arable Land FemalesFemalesFemales PopulationPercent of PopulationPercent of Married Women ContraceptionMaternal Deaths per Percent Ages 15-24 Tertiary School Gender Parity of Labor Force Participation RatesFemale Share of Nonagricultural Wage EarnersFemale Share of Parliament © 2015 Population Reference Bureau 2015 WORLD POPULATION DATA SHEET A date range indicates the most recent data point during national statistics reported as completely registered, while those without are estimates from the sources cited on the reverse. Rates shown in italics are based on fewer than 50 annual infant deaths, so the gure is estimated from an average of the previous three years.Average number of children born to a woman during Data prior to 2014 are shown in italics.Data prior to 2009 are shown in italics.The status of Western Sahara is disputed by Morocco.Kosovo declared independence from Serbia on Feb. 17, 2008. Serbia has not recognized Kosovo’s independence.The former Yugoslav Republic.For additional notes and sources, see reverse side.Data prepared by PRB demographers Toshiko Kaneda and © August 2015. Population Reference Bureau. All rights reserved. Acknowledgments, Notes, Sources, and DefinitionsThe authors gratefully acknowledge the valuable assistance of PRB senior consultant, Carl Haub; PRB staff members John May, Kelvin Pollard, Donna Clifton, Carolyn Lamere, Heather Randall, and Nicole LaGrone; PRB interns Heather Zaccaro, Adaeze Ezeofor, and Kimberly Rightor; and staff of the International Programs Center of the U.S. Census Bureau; the United Nations (UN) Population Division; and the Institut national d’etudes démographiques (INED), Paris, in the preparation of this year’s World Population Data Sheet.This publication is funded by the William and Flora Hewlett Foundation, the David and Lucile Packard Foundation, the U.S. Agency for International Development (IDEA Project, No. AID-0AA-A-10-00009), and supporters. The contents are the responsibility of the Population Reference Bureau and do not necessarily reect the views of USAID or the United States government.The Data Sheet lists all geopolitical entities with populations of 150,000 or more and all members of the UN. These include sovereign states, dependencies, overseas departments, and some territories whose status or boundaries may be undetermined or in dispute. More developed regions, following the UN classication, comprise all of Europe and North America, plus Australia, Japan, and New Zealand. All other regions and countries are classied as less developed. The least developed countries consist of 48 countries with especially low incomes, high economic vulnerability, and poor human development indicators; 34 of these countries are in sub-Saharan Africa, 13 in Asia, and one in the Caribbean. The criteria and list of countries, as dened by the UN, can be found at http://unohrlls.org/about-ldcs/.Sub-Saharan Africa: All countries of Africa except the northern African countries of Algeria, Egypt, Libya, Morocco, Sudan, Tunisia, and Western Sahara.World and Regional Totals: Regional population totals are independently rounded and include small countries or areas not shown. Regional and world rates and percentages are weighted averages of countries for which data are available. For most indicators, regional averages are shown when data or estimates are available for at least three-quarters of the region’s population. ForSecondary School Enrollment Ratios, HIV Prevalence Rates, and Female Share of Nonagricultural Wage Earners, regional averages are shown when data or estimates are available for at least half of the region’s population.World Population Data Sheets from different years should not be used as a time series. Fluctuations in values from year to year often reect revisions based on new data or estimates rather than actual changes in levels. Additional information on likely trends and consistent time series can be obtained from PRB, and are also available from UN and U.S. Census Bureau publications and websites.The rates and gures are primarily compiled from the following sources: ofcial country statistical yearbooks, bulletins, and websites; the UN Demographic Yearbook, 2013; and Population and Vital Statistics Report of the UN Statistics Division; World Population Prospects: The 2015 Revision of the UN Population Division; and the International Data Base of the International Programs Center, U.S. Census Bureau. Other sources include recent demographic surveys such as the Demographic and Health Surveys, Multiple Indicator Cluster Surveys, special studies, and direct communication with demographers and statistical bureaus in the United States and abroad. Specic data sources may be obtained by contacting the authors of the 2015 World Population Data Sheet. For countries with complete registration of births and deaths, rates are those most recently reported. For more developed countries, nearly all vital rates refer to 2014 or 2013.Mid-2015 PopulationEstimates are based on a recent census, ofcial national data, or PRB, UN, and U.S. Census Bureau projections. The effects of refugee movements, large numbers of foreign workers, and population shifts due to contemporary political events are taken into account to the extent possible.Birth and Death RateThe annual number of births and deaths per 1,000 total population. These rates are often referred to as “crude rates” since they do not take a population’s age structure into account. Thus, crude death rates in more developed countries with a relatively large proportion of high-mortality older population are often higher than those in less developed countries with lower life expectancy.Net MigrationThe estimated rate of net immigration (immigration minus emigration) per 1,000 population for a recent year based upon the ofcial national rate or derived as a residual from estimated birth, death, and population growth rates. Migration rates can vary substantially from year to year for any particular country, as can the denition of an immigrant.Projected Population, 2030 and 2050Projected populations based on reasonable assumptions on the future course of fertility, mortality, and migration. Projections are based on ofcial country projections, series issued by the UN or the U.S. Census Bureau, or PRB projections.Infant Mortality RateThe annual number of deaths of infants under age 1 per 1,000 live births. Rates shown with decimals indicate national statistics reported as completely registered, while those without are estimates from the sources cited above. Rates shown in italics are based upon fewer than 50 annual infant deaths and, as a result, are subject to considerable yearly variability; rates shown for such countries are averages for a multiple-year period. Total Fertility Rate (TFR)The average number of children a woman would have assuming that current age-specic birth rates remain constant throughout her childbearing years (usually considered to be ages 15 to 49).Population Under Age 15/Age 65+The percentage of the total population in those ages, which are often considered the “dependent ages.” GNI PPP per Capita, 2014 (US$)GNI PPP per capita is gross national income in purchasing power parity (PPP) divided by mid-year population. GNI PPP refers to gross national income converted to “international” dollars using a purchasing power parity conversion factor. PPP adjusts exchange rates to relative purchasing power in different countries, providing a more accurate basis of comparison for GNI. Data are from the World Bank. Figures in italics are for 2013, 2012, or 2011.Percent UrbanPercentage of the total population living in areas termed “urban” by that country or by the UN. Countries dene urban in many different ways, from population centers of 100 or more dwellings to only the population living in national and provincial capitals.Population per Square Kilometer of Arable LandThe mid-year 2015 population divided by the square kilometers of arable land. Arable land is dened by the UN Food and Agriculture Organization (FAO) to include “the land under temporary agricultural crops (multiple-cropped areas are counted only once), temporary meadows for mowing or pasture, land under market and kitchen gardens and land temporarily fallow (less than ve years).” Data for the percent of land that is arable and the square kilometers in a country are from the FAO.Contraceptive UseThe percentage of currently married or “in union” women of reproductive age who are currently using any form of contraception. Modern methods include clinic and supply methods such as the pill, IUD, condom, and sterilization. Data are from the most recently available national-level surveys, such as Demographic and Health Surveys, Reproductive Health Surveys, Multiple Indicator Cluster Surveys, regional survey programs, national surveys, and the UN Population Division World Contraceptive Use 2014. Data prior to 2009 are shown in italics.Life Expectancy at BirthThe average number of years a newborn infant can expect to live under current mortality rates. Maternal Deaths per 100,000 Births Maternal deaths in a time period divided by the number of live births in the same period, expressed per 100,000 live births. A maternal death is dened by the World Health Organization (WHO) as “the death of a woman while pregnant or within 42 days of the termination of pregnancy, irrespective of the duration and site of the pregnancy, from any cause to or aggravated by the pregnancy or its management but not from accidental or incidental causes.” Data are from the 2014 report Trends in Maternal Mortality: 1990 to 2013that compiles estimates by WHO, UNICEF, UNFPA, the World Bank, and the UN Population Division. HIV Prevalence The proportion of the population living with HIV regardless of the time of infection, knowledge of the infection, or stage of the disease. Data are from UNAIDS.Secondary School Enrollment RatioThe number of students enrolled in secondary education divided by the secondary-school-age population (Gross Enrollment Ratio). The ratio can be over 100 when there are students enrolled who are older or younger than the age expected for secondary school students. Data are from UNESCO for 2008-2014. Tertiary School Gender Parity IndexThe tertiary education gross enrollment ratio for women divided by the tertiary gross enrollment ratio for men. An index less than one indicates that men are more represented in higher education than women, while an index greater than one indicates that women are more represented. Data are from UNESCO for 2008-2014.Gender Ratio of Labor Force Participation RatesThe ratio of the female labor force participation rate over the male rate. The labor force participation rate is dened as the proportion of the population ages 15 years and older who are economically active, including those employed and unemployed. A ratio less than one indicates that the male labor force participation rate is greater than the female rate while a ratio of more than one indicates that the female rate is greater than the male rate. Data are from the World Bank for 2013. Female Share of Nonagricultural Wage EarnersThe percent of workers in wage employment in the nonagricultural sector who are women. In a small number of countries the denition of the sector is one of the following: the economically active population in nonagriculture, total employment, total employment in nonagriculture, total paid employment, and employment in the public sector. Data are from the UN from 2008-2013. Female Share of Parliament MembersThe percentage of seats in a country’s single chamber, combined higher and lower chambers of the national parliament, or other national legislature held by women. Data are from the Inter-Parliamentary Union from May 1, 2015. PRB’s 2015 World Population Data Sheet is available in English, French, and Spanish at www.prb.org. Also online:A customized Data Dashboard where users can view multiple indicators for regions or countries.A video focusing on what the data say about the state of women’s empowerment. An interactive world map illustrating key demographic variables by country and region.To order PRB publications (discounts available for bulk orders):Online at www.prb.org.E-mail: popref@prb.org.Call toll-free: 800-877-9881.Fax: 202-328-3937.Mail: 1875 Connecticut Ave., NW, Suite 520, Washington, DC 20009.Data prepared by PRB demographers Toshiko Kaneda and Kristin Bietsch.© August 2015. Population Reference Bureau.All rights reserved.ISSN 0085-8315Photo credit, cover: © Jörg Dickmann, goZOOMA Facebook “f” LogoCMYK / .epsFacebook “f” LogoCMYK / .eps 1875 Connecticut Ave., NW, Washington, DC 20009 USAe-mail: popref@prb.org | website: www.prb.org POPULATION REFERENCE BUREAU people around the world about population, health, and the environment, and them to use that information to the well-being of current and future generations.PRB analyzes complex demographic data and research to provide the most objective, accurate, and up-to-date population information in formats that are easily understood by advocates, journalists, and decisionmakers alike.INNOVATIVE TOOLS.PRB creates interactive content to make data and research more accessible to users. An projections of U.S. child poverty and other social indicators viewer. INFLUENTIAL PUBLICATIONS.looks at gaps in key development indicators between urban and rural dwellers in many low- and middle-income countries. MULTIMEDIA.PRB has produced hundreds of cutting-edge video and audio presentations that distill the knowledge of PRB’s website provides access to all of our content, including our respected Data Sheets, , visualizations, and data and analysis on world issues ranging from gender to aging to family planning.PRB empowers people—researchers, journalists, policymakers, and educators—to use information about population, health, and the environment to encourage action. Frequently, people have information but lack the skills and tools needed to communicate effectively to decisionmakers. PRB builds coalitions and conducts trainings to share techniques to inform policy. PRB strengthens the capacity of journalists from developing countries through seminars and study tours. We organized several study tours for journalists projects and the people they affect.POLICY COMMUNICATION TRAINING.In the past ve years, PRB has trained more than 1,000 professionals in Asia, Africa, and Latin America to communicate data and research effectively. Each year, for example, we have sponsored two workshops with Kenya’s National Council for Population and Development, training local and regional policymakers, program managers, and advocates. PRB developed and coordinates the American Community Survey (ACS) Data Users Group to increase understanding of the value and utility of ACS data and to facilitate communication among ACS data users about key ACS data issues and applications. This group connects ACS data users and helps them share information and materials through an online community forum, webinars, special sessions at professional meetings, and an annual conference.ADVANCEPRB works to ensure that policymakers worldwide rely on to inform population, health, and environmental policies. While the numbers of publications created or workshops conducted are one way to measure PRB’s work, the adoption of evidence-based policies, increased demand for health services, and active coalitions are better gauges of progress toward positive PRB provides analysis for the KIDS COUNT Data Book, an annual report card on the well-being of children and families in the United States. The Data Book has helped promote the passage of several U.S. policies, including the State Children’s Health Insurance Program. DEMAND FOR HEALTH SERVICES.TV reporting in India by an alumna of PRB’s Women’s Edition training program led to the creation of health camps to care for pregnant women in the slums. Another led to the renewal of a family planning program that promoted birth spacing. Population, Health, and Environment Network to increase information sharing across the region. In the Lake Victoria Basin, PRB also provides technical assistance on integrated population, health, and environment development in the region. The authors gratefully acknowledge the valuable assistance of PRB senior consultant, Carl Haub; PRB staff members John May, Kelvin Pollard, Donna Clifton, Carolyn Lamere, Heather Randall, and Nicole LaGrone; PRB interns Heather Zaccaro, Adaeze Ezeofor, and Kimberly Rightor; and staff of the International Programs Center of the U.S. Census Bureau; the United Nations (UN) Population Division; and the Institut national d’etudes démographiques (INED), Paris, in the preparation of this year’s World Population Data Sheet.This publication is funded by the William and Flora Hewlett Foundation, the David and Lucile Packard Foundation, the U.S. Agency for Interna-tional Development (IDEA Project, No. AID-0AA-A-10-00009), and supporters. The contents are the responsibility of the Population Reference Bureau and do not necessarily re ect the views of USAID or the United States government.The Data Sheet lists all geopolitical entities with populations of 150,000 or more and all mem-bers of the UN. These include sovereign states, dependencies, overseas departments, and some territories whose status or boundaries may be undetermined or in dispute. More developedregions, following the UN classi cation, comprise all of Europe and North America, plus Australia, Japan, and New Zealand. All other regions and countries are classi ed as less developed. The least developed countries consist of 48 coun-tries with especially low incomes, high economic vulnerability, and poor human development indi-cators; 34 of these countries are in sub-Saharan Africa, 13 in Asia, and one in the Caribbean. The criteria and list of countries, as de ned by the UN, can be found at http://unohrlls.org/about-ldcs/.Sub-Saharan Africa: All countries of Africa except the northern African countries of Algeria, Egypt, Libya, Morocco, Sudan, Tunisia, and Western Sahara.World and Regional Totals: Regional population totals are independently rounded and include small countries or areas not shown. Regional and world rates and percentages are weighted averages of countries for which data are available. For most indicators, regional averages are shown when data or estimates are available for at least three-quarters of the region’s population. ForSecondary School Enrollment Ratios, HIV Prevalence Rates, and Female Share of Nonagricultural Wage Earn-ers, regional averages are shown when data or estimates are available for at least half of the region’s population.World Population Data Sheets from different years should not be used as a time seriesFluctuations in values from year to year often re ect revisions based on new data or estimates rather than actual changes in levels. Additional information on likely trends and consistent time series can be obtained from PRB, and are also available from UN and U.S. Census Bureau publi-cations and websites.The rates and  gures are primarily compiled from the following sources: of cial country statistical yearbooks, bulletins, and websites; the UN Demographic Yearbook, 2013; and Population and Vital Statistics Report of the UN Statistics Division; World Population Prospects: The 2015 Revision of the UN Population Division; and the International Data Base of the International Programs Center, U.S. Census Bureau. Other sources include recent demographic surveys such as the Demographic and Health Surveys, Multiple Indicator Cluster Surveys, special studies, and direct communication with demographers and statistical bureaus in the United States and abroad. Speci c data sources may be obtained by contacting the authors of the 2015 World Population Data Sheet. For countries with complete registration of births and deaths, rates are those most recently reported. For more developed countries, nearly all vital rates refer to 2014 or 2013.Mid-2015 PopulationEstimates are based on a recent census, of cial national data, or PRB, UN, and U.S. Census Bureau projections. The effects of refugee movements, large numbers of foreign workers, and population shifts due to contemporary political events are taken into account to the extent possible.Birth and Death RateThe annual number of births and deaths per 1,000 total population. These rates are often referred to as “crude rates” since they do not take a population’s age structure into account. Thus, crude death rates in more developed countries with a relatively large proportion of high-mortality older population are often higher than those in less developed countries with lower life expectancy.Net MigrationThe estimated rate of net immigration (immigration minus emigration) per 1,000 population for a recent year based upon the of cial national rate or derived as a residual from estimated birth, death, and population growth rates. Migration rates can vary substantially from year to year for any particular country, as can the de nition of an immigrant.Projected Population, 2030 and 2050Projected populations based on reasonable assumptions on the future course of fertility, mortality, and migration. Projections are based on of cial country projections, series issued by the UN or the U.S. Census Bureau, or PRB projections.Infant Mortality RateThe annual number of deaths of infants under age 1 per 1,000 live births. Rates shown with decimals indicate national statistics reported as completely registered, while those without are estimates from the sources cited above. Rates shown in italics are based upon fewer than 50 annual infant deaths and, as a result, are subject to considerable yearly variability; rates shown for such countries are averages for a multiple-year period. Total Fertility Rate (TFR)The average number of children a woman would have assuming that current age-speci c birth rates remain constant throughout her childbearing years (usually considered to be ages 15 to 49).Population Under Age 15/Age 65+The percentage of the total population in those ages, which are often considered the “dependent ages.” GNI PPP per Capita, 2014 (US$)GNI PPP per capita is gross national income in purchasing power parity (PPP) divided by mid-year population. GNI PPP refers to gross national income converted to “international” dollars using a purchasing power parity conversion factor. PPP adjusts exchange rates to relative purchasing power in different countries, providing a more ac-curate basis of comparison for GNI. Data are from the World Bank. Figures in italics are for 2013, 2012, or 2011.Percent UrbanPercentage of the total population living in areas termed “urban” by that country or by the UN. Countries de ne urban in many different ways, from population centers of 100 or more dwellings to only the population living in national and provincial capitals.Population per Square Kilometer of Arable LandThe mid-year 2015 population divided by the square kilometers of arable land. Arable land is de ned by the UN Food and Agriculture Organization (FAO) to include “the land under temporary agricultural crops (multiple-cropped areas are counted only once), temporary meadows for mowing or pasture, land under market and kitchen gardens and land temporarily fallow (less than  ve years).” Data for the percent of land that is arable and the square kilometers in a country are from the FAO.Contraceptive UseThe percentage of currently married or “in union” women of reproductive age who are currently using any form of contraception. Modern methods include clinic and supply methods such as the pill, IUD, condom, and sterilization. Data are from the most recently available national-level surveys, such as Demographic and Health Surveys, Reproductive Health Surveys, Multiple Indicator Cluster Surveys, regional survey programs, national surveys, and the UN Population Division World Contraceptive Use 2014. Data prior to 2009 are shown in italics.Life Expectancy at BirthThe average number of years a newborn infant can expect to live under current mortality rates. Maternal Deaths per 100,000 Births Maternal deaths in a time period divided by the number of live births in the same period, expressed per 100,000 live births. A maternal death is de ned by the World Health Organization (WHO) as “the death of a woman while pregnant or within 42 days of the termination of pregnancy, irrespective of the duration and site of the pregnancy, from any cause to or aggravated by the pregnancy or its management but not from accidental or incidental causes.” Data are from the 2014 report Trends in Maternal Mortality: 1990 to 2013 that compiles estimates by WHO, UNICEF, UNFPA, the World Bank, and the UN Population Division. HIV Prevalence The proportion of the population living with HIV regardless of the time of infection, knowledge of the infection, or stage of the disease. Data are from UNAIDS.Secondary School Enrollment RatioThe number of students enrolled in secondary education divided by the secondary-school-age population (Gross Enrollment Ratio). The ratio can be over 100 when there are students enrolled who are older or younger than the age expected for secondary school students. Data are from UNESCO for 2008-2014. Tertiary School Gender Parity IndexThe tertiary education gross enrollment ratio for women divided by the tertiary gross enrollment ratio for men. An index less than one indicates that men are more represented in higher education than women, while an index greater than one indicates that women are more represented. Data are from UNESCO for 2008-2014.Gender Ratio of Labor Force Participation RatesThe ratio of the female labor force participation rate over the male rate. The labor force participation rate is de ned as the proportion of the population ages 15 years and older who are economically active, including those employed and unemployed. A ratio less than one indicates that the male labor force participation rate is greater than the female rate while a ratio of more than one indicates that the female rate is greater than the male rate. Data are from the World Bank for 2013. Female Share of Nonagricultural Wage EarnersThe percent of workers in wage employment in the nonagricultural sector who are women. In a small number of countries the de nition of the sector is one of the following: the economically active population in nonagriculture, total employment, total employment in nonagriculture, total paid employment, and employment in the public sector. Data are from the UN from 2008-2013. Female Share of Parliament MembersThe percentage of seats in a country’s single chamber, combined higher and lower chambers of the national parliament, or other national legislature held by women. Data are from the Inter-Parliamentary Union from May 1, 2015. Acknowledgments, Notes, Sources, and De nitionsPOPULATION REFERENCE BUREAU people around the world about population, health, and the environment, and them to the well-being of current and future generations.1875 Connecticut Ave., NW, Suite 520, Washington, DC 20009 USAtel. 202-483-1100 • fax 202-328-3937 • e-mail: popref@prb.org • website: www.prb.org If you value PRB’s World Population Data Sheet and are among the tens of thousands of people who eagerly anticipate its publication each year, please consider making a contribution to PRB. Your donation will help ensure that PRB can maintain its commitment to keeping the as affordable as possible. Visit our website to donate now: www.prb.org.research to provide the most objective, accurate, that are easily understood by advocates, journalists, and decisionmakers alike.INNOVATIVE TOOLS.PRB creates interactive content to make data and research more how projections of U.S. child poverty and the viewer. INFLUENTIAL PUBLICATIONS.looks at gaps in key development indicators between urban and rural dwellers in many low- and middle-income countries. MULTIMEDIA.PRB has produced hundreds of cutting-edge video and audio presentations PRB’s website provides access to all of our content, including our respected Data Sheets, visualizations, and data and analysis on world issues ranging from gender to aging to family PRB empowers people—researchers, journalists, policymakers, and educators—to use information about population, health, and the environment to encourage action. Frequently, people have information but lack the skills and tools needed to communicate effectively to decisionmakers. PRB builds coalitions and conducts trainings to share techniques to inform policy. PRB strengthens the capacity of journalists from developing countries through seminars and study tours. We organized several study tours for journalists in to visit projects and the people they affect.POLICY COMMUNICATION TRAINING.In the past  ve years, PRB has trained more than 1,000 professionals in Asia, Africa, and Latin America to communicate data and research effectively. Each year, for example, we have sponsored two workshops with Kenya’s National Council for Population and Development, training local and regional policymakers, program managers, and advocates. PRB developed and coordinates the American Community Survey (ACS) Data Users Group to increase understanding of the value and utility of ACS data and to facilitate key ACS data issues and applications. This group connects ACS data users and helps them share information and materials through an online community forum, webinars, special sessions at professional meetings, and an annual conference.ADVANCEPRB works to ensure that policymakers worldwide rely on sound evidence, rather than anecdotal or and environmental policies. While the numbers of publications created or workshops conducted are one way to measure PRB’s work, the adoption of evidence-based policies, increased demand for health services, and active coalitions are better gauges of progress toward positive social change. PRB provides analysis for the KIDS COUNT Data Book, an annual report card on the well-being of children and families in the United States. The Data Book has helped promote the passage of several U.S. policies, including the State Children’s Health Insurance Program. DEMAND FOR HEALTH SERVICES.TV reporting in India by an alumna of PRB’s Women’s Edition training program led to the creation of health camps to care for pregnant women in the slums. Another led to the renewal of a family planning program that promoted birth spacing. East Africa Population, Health, and Environment Network to increase information sharing across the region. In the Lake Victoria Basin, PRB also provides technical assistance on integrated population, health, and environment development in the region. PRB’s 2015 World Population Data Sheetis available in English, French, and Spanish at www.prb.org. Also online:A customized Data Dashboard where users can view multiple indicators for regions or countries.A video focusing on what the data say about the state of women’s empowerment. An interactive world map illustrating key demographic variables by country and region.To order PRB publications (discounts available for bulk orders):Online at www.prb.org.E-mail: popref@prb.org.Call toll-free: 800-877-9881.Fax: 202-328-3937.Mail: 1875 Connecticut Ave., NW, Suite 520, Washington, DC 20009.Data prepared by PRB demographers Toshiko Kaneda and Kristin Bietsch.© August 2015. Population Reference Bureau.All rights reserved. ISSN 0085-8315Photo credit, cover: © Jörg Dickmann, goZOOMA WomenWomenWomenWomenWomenWomenshow percent in 2011show percent in 2014 Financial Inclusion of Women ExpandsFinancial inclusion—making appropriate, affordable, and convenient  nancial services available to all people—is a global development priority. For women, access to savings, credit, and other services can help them gain more  nancial independence, better manage and leverage their resources, and build capital to support income-generating activities. A core measure of  nancial inclusion is whether an individual uses an account at a bank or other formal  nancial institution. In most countries, even many least developed ones, the share of women with such accounts has increased over the past few years. Gaps remain between men and women, but these have narrowed in many cases, and most developed countries show effective gender parity at high levels of usage. Rapid expansion of mobile money and other  nancial services available via mobile devices, particularly in Africa, provide a convenient way for both men and women to access such services. Women are currently using mobile more than other formal accounts in several African countries (see table).Source: World Bank, Global Findex Database. WORLD POPULATION HIGHLIGHTSFOCUS ON WOMEN’S EMPOWERMENT Large Purchases Jordan 01020307090100172018151832274753665737426574667583748488917177896479725617 KenyaEgyptPhilippinesPakistanJordanSenegalNigeria 20142010 2006 2002 1998 1994 1990 6441587140362113314313524780 Women 25-29Women 25+ Rates of Early Marriage Fall, Particularly Among Those Under 15 Early marriage (before age 18) undermines the rights and livelihood opportunities of adolescent girls by leaving them vulnerable to the health risks of early pregnancy and childbearing, and prematurely ending their schooling. Rates of early marriage have declined broadly in the past 20 years, particularly among girls who are under age 15. Part of the overall decline re ects improvements in girls’ access to education: As girls educational attainment improves, the proportion marrying early tends to fall. Better employment opportunities for women and girls arriage among rural migrants under age 15. The percentage of Bangladeshi girls married by age 18 has declined much more slowly as the youngest potential brides tend to postpone marriage by only a few years. The majority of Bangladeshi girls continue to marry before age 18. Women Post Uneven Gains in Household Decisionmaking PowerMarried women in many countries are increasingly likely to have a say in household decisions, but these gains do not necessarily apply to every type of decision. When women are included in decisions about household spending, more money tends to be spent for the bene t of women and children. And when women are able to make decisions about their health care, they are less vulnerable to preventable diseases. Progress in these areas has varied by country, and even in countries showing notable gains, many women still do not engage in all types of important decisions. For example, in Nepal, only 66 percent of women have a say about their own health care decisions. The same percentage of Zambian women have the opportunity to make decisions about large household purchases.Family Planning Needs Increasingly Met by Modern Methods, but More Progress Needed “Demand for family planning satis ed with modern methods” has emerged as a key indicator of contraceptive availability and use. The indicator measures the proportion of women who want to delay or limit childbearing and who are using modern methods of contraception. Family planning experts have urged countries to strive for meeting at least 75 percent of demand with modern methods. Over the past two decades, a signi cant number of less developed countries have seen increases in the share of demand satis ed with modern methods, but many countries remain far below the proposed 75 percent benchmark. They will need to accelerate progress over the coming decade so that increased contraceptive use can translate into improved maternal and child health, slower population growth, increased economic well-being, and environmental sustainability.U.S. Gender Gap in College Completion Eases; Earnings Gap Persists Educational attainment in the United States has risen substantially over the last four decades. Between 1970 and 2014, the share of men ages 25 and older with at least a college degree climbed from 14 percent to 32 percent, while the share of adult women with at least a college degree quadrupled from 8 percent to 32 percent. For ages 25 to 29 only, the share of women with a bachelor’s degree or higher actually started outpacing the share for men in 1991. But women still lag behind men in earnings. Among full-time, year-round workers ages 25 and older in 2013, women’s median earnings were about 79 percent of men’s, up from 71 percent in 1993 (see table). This gender earnings gap persists across all educational levels. For bachelor’s degree holders, one factor may be that women are less likely to get degrees in higher-earning  elds such as science and engineering. In 2013, among adults ages 25 and older with a bachelor’s degree, only 26 percent of women had a degree in science and engineering, compared with 44 percent of men. However, even among full-time, year-round workers with engineering degrees, women’s median earnings in 2011 were only 83 percent of men’s. Data points are for each corresponding survey year.Source: ICF International, Demographic and Health Surveys.Source: ICF International, Demographic and Health Surveys.Source: International, Demographic and Health Surveys.Source: Census Bureau: 1970 to 2002 March Current Population Survey; 2003 to 2014 Annual Social and Economic Supplement to the Current Population Survey; American Community Survey Brief 11-10 (Oct. 2012); and PRB analysis of data from the 2013 American Community Survey. Percent of Young Women Married by Age 15 (numbers in white) and Age 18 (numbers in black)Percent of Demand for Family Planning Satis ed by Modern Contraceptive MethodsPercent Who Have Completed College, by AgePercent of Currently Married Women Who Have a Say in Decisions About This TopicPercent Who Have Used an Account at a Formal Financial Institution 837673654941271718192021991–19922141992201120002011199–199420121992PeruEgyptEthiopiaBangladeshNiger4728472919167 2 3 3 Percent of Women Using Financial Services by Type, 2014 Mobile Financial Other Formal Financial Institution te d'Ivoire Tanzania Female-to-Male Median Earnings Ratio Among Full-Time Year-Round Workers1993High School Some College, No DegreeBachelor’s Degree Bachelor’s Degree or MoreRatios are expressed as a percent.Percent Who Agree That Husband Is Justi ed Beating Wife if She Leaves the House Without Informing HimAcceptance of Wife Beating Recedes Violence against women poses a serious challenge to women’s empowerment. Combating such violence often requires changing the attitudes and beliefs of both men and women. In fact, in some countries, substantial percentages of women actually agree that a husband has the right to beat a wife under certain circumstances. Many of these women believe a husband is justi ed in hitting a wife ries. For example, in 2013, 13 percent of Nigerian men and 25 percent of Nigerian women viewed a wife leaving home without telling the husband as justi cation for wife beating, down from 19 percent and 32 percent, respectively, in 2008. Zambia also showed notable drops for both men and women between 2007 and 2013-2014. Globally, however, there is still a long path to achieve zero global tolerance of this harmful practice. Source: ICF International, Demographic and Health Surveys. Women MOST POPULOUS COUNTRIES,2015 AND 2050COUNTRY, 2050POPULATION COUNTRY, 2015POPULATION COUNTRIESWITH THE HIGHEST AND LOWEST TOTAL FERTILITY RATESCongo, Dem. Rep. POPULATION CLOCK,2015MORE DEVELOPED LESS DEVELOPED 7,336,435,0001,254,199,0006,082,235,000Year145,973,00013,760,000132,213,000399,92637,700362,226278252Year57,052,00012,283,00044,769,000156,30633,652122,65410923Natural increase perYear88,921,0001,477,00087,444,000243,6204,047239,573169166Year5,351,00073,0005,278,00014,660 201 14,459 10 0.1 10 Korea, SouthTaiwanGreeceSingapore Worldwide average life expectancy in years—7.3$15,030Average global gross capita—$39,020 in more INFORM | EMPOWER | ADVANCE | www.prb.org POPULATION REFERENCE BUREAU2015 World Population Data Sheet with a special focus on women’s empowerment PopulationPopulationPopulationPopulationInfant Total Fertility Percent of Population Percent Population Percent of Married Women 15-49 Using Life Expectancy Percent Ages Secondary SchoolTertiary Parity IndexParticipation Rates Female Share of Wage EarnersFemale Share of Parliament SexesFemalesFemales Females NORTHERN AFRICA MoroccoTunisiaWestern SaharaCape VerdeCôte d’Ivoire TogoComorosEritrea Tanzania CameroonSao Tome and Principe NORTHERN AMERICALATIN AMERICA AND THE CARIBBEAN Grenada St. Vincent and the GrenadinesTrinidad and TobagoArgentina French GuianaVenezuelaArmenia GeorgiaJordanPalestinian TerritoryTurkey YemenKyrgyzstanTajikistanTurkmenistan Singapore Timor-LesteViet NamKorea, NorthKorea, SouthTaiwan NORTHERN EUROPEIreland GermanyLuxembourg CroatiaGreece MontenegroFederated States of MicronesiaFrench Polynesia TongaTuvaluVanuatuPopulation PopulationPopulationMigration Total FertilityPercent Population of Arable Land FemalesFemalesFemales PopulationPercent of PopulationPercent of Married Women ContraceptionMaternal Deaths per Percent Ages 15-24 Tertiary School Gender Parity of Labor Force Participation RatesFemale Share of Nonagricultural Wage EarnersFemale Share of Parliament PopulationPopulationPopulationPopulationInfant Total Fertility Percent of Population Percent Population Percent of Married Women 15-49 Using Life Expectancy Percent Ages Secondary SchoolTertiary Parity IndexParticipation Rates Female Share of Wage EarnersFemale Share of Parliament SexesFemalesFemales Females NORTHERN AFRICA MoroccoTunisiaWestern SaharaCape VerdeCôte d’Ivoire TogoComorosEritrea Tanzania CameroonSao Tome and Principe NORTHERN AMERICALATIN AMERICA AND THE CARIBBEAN Grenada St. Vincent and the GrenadinesTrinidad and TobagoArgentina French GuianaVenezuelaArmenia GeorgiaJordanPalestinian TerritoryTurkey YemenKyrgyzstanTajikistanTurkmenistan Singapore Timor-LesteViet NamKorea, NorthKorea, SouthTaiwan NORTHERN EUROPEIreland GermanyLuxembourg CroatiaGreece MontenegroFederated States of MicronesiaFrench Polynesia TongaTuvaluVanuatuPopulation PopulationPopulationMigration Total FertilityPercent Population of Arable Land FemalesFemalesFemales PopulationPercent of PopulationPercent of Married Women ContraceptionMaternal Deaths per Percent Ages 15-24 Tertiary School Gender Parity of Labor Force Participation RatesFemale Share of Nonagricultural Wage EarnersFemale Share of Parliament