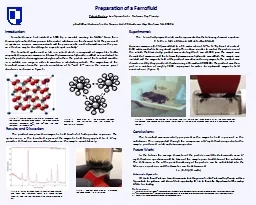
/
Preparation of a Ferrofluid Preparation of a Ferrofluid

Preparation of a Ferrofluid - PowerPoint Presentation

natalia-silvester
natalia-silvester . @natalia-silvester
Follow
466 views
Uploaded On 2015-11-24

Preparation of a Ferrofluid - PPT Presentation

Acknowledgments Id like to thank Professor James Krzanowski for letting us use his lab Professor Roy Planalp and Lea Nyiranshuti for guidance and advice Most importantly Id like to thank the ID: 204407

magnetic ferrofluid figure field ferrofluid magnetic field figure sample ray diffraction represent lab product spectra 2015 fe3 surfactant particle added fe2 visualization

Share:

Link:

Embed:

Download Presentation from below link

Download Presentation The PPT/PDF document "Preparation of a Ferrofluid" is the property of its rightful owner. Permission is granted to download and print the materials on this web site for personal, non-commercial use only, and to display it on your personal computer provided you do not modify the materials and that you retain all copyright notices contained in the materials. By downloading content from our website, you accept the terms of this agreement.


Presentation Transcript

Slide1

Preparation of a Ferrofluid

Acknowledgments:

I’d like to thank Professor James Krzanowski, for letting us use his lab, Professor Roy Planalp and Lea Nyiranshuti for guidance and advice. Most importantly, I’d like to thank the Department of Chemistry, UNH, for funding.

Patrick Curley, Lea Nyiranshuti, Professor Roy Planalppbw9@wildcats.unh.edu; Parsons Hall, 23 Academic Way, Durham, NH; 03824

Introduction: Ferrofluids were first isolated in 1965 by a scientist working for NASA.1 Since their discovery, ferrofluids have proven to be useful substances in the chemical field. They are used in speakers, sensors, vacuum sealant, and they can even be used in biomedicine, as they are an effective way to direct drugs to a specific spot in a body.2 The ferrofluid synthesized in lab is a colloid which is comprised of magnetite, Fe3O4, suspended in aqueous ammonia. Tetramethylammonium hydroxide is added as a surfactant to keep the particles from agglomerating to each other. The particle size of the ferrofluid must be in a suitable size range in order to maintain a satisfactory colloid. The magnetism of the ferrofluid comes from the specific orientation of Fe2+ and Fe3+ ions in the inverse spinel structure, as shown in Figure 1.

References 1.)“A Brief History of Ferrofluids” ;  Concept Zero, http://www.czferro.com/news1/2014/10/27/history‐of‐ferrofluids ; 2015, accessed 3/9/2015. 2.)“Ferrofluid Applications”; Ferrotec; Ferrotec Corporation; https://ferrofluid.ferrotec. com/ applications/ferrofluid; 2015, accessed 3/9/20153.) Gunn, Erica; Preparation of a Ferrofluid; Simmons College, 2015

Results and Discussion: The product was placed in a magnetic field to which it had a positive response. The spikes seen in the ferrofluid represent the magnetic field being applied to it. X-ray powder diffraction was used to characterize the sample quantitatively.

Conclusions: The ferrofluid was successfully prepared, as the magnetic field is present in the substance. This is supported through the comparison of X-ray diffraction spectra for the sample produced in lab and a known spectra.

Future Work: In the future, the average diameter of the particles could be determined, as an X-ray diffraction spectrum could be taken of the sample prior to addition of the surfactant. The difference in the of the peak broadening of the particle can be substituted into the Scherrer equation, and the diameter can be determined. t = (0.9 λ)/(B cosθB)

Figure 3: Magnetic field applied to ferrofluid. The first picture was taken directly after the substance was synthesized. The second picture shows the ferrofluid attracted to the magnetic poles while in a isopropanol/water solution .

Experimental: The ferrofluid prepared in lab can be represented as the following chemical equation:2 FeCl3 + FeCl2 + 8 NH3 + 4 H2O → Fe3O4 + 8 NH4ClAqueous ammonia (0.7 M) was added to a 2:1 molar ratio of Fe3+ to Fe2+ by buret at a rate of 0.33 mL/second while being stirred rapidly. This is done in order to control the particle size of the colloid. The black sludge product was centrifuged for 1 min at 1000 rpm. The sample was decanted of ammonia and the tetramethylammonium hydroxide was added. The sample was isolated and the magnetic field of the product was observed using magnets. The product was characterized by X-ray powder diffraction using a Shimadzu XRD-6100. The product was then put in a solution of roughly 70:30 isopropanol to water for optimized magnetic field visualization. (Figure 3)

Figure

1

3

:Inverse spinel structure of magnetite. The red spheres represent oxide anions, the green spheres represent octahedral Fe3+ and Fe2+ while the blue represent tetrahedral Fe3+.

Figure 2: Visualization of the interaction between magnetite and surfactant, and the creation of electrostatic repulsion.

Figure 4:

X-ray diffraction spectra from ferrofluid sample. The black lines represent peaks of a known ferrofluid spectra, while the red represents the sample prepared in lab.

Figure

5:

Another visualization of a magnetic field being applied to a ferrofluid.