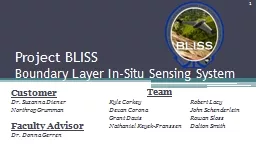
Kyle Corkey Devan Corona Grant Davis Nathaniel KeyekFranssen Customer Dr Suzanna Diener Northrop Grumman Faculty Advisor Dr Donna Gerren Robert Lacy John Schenderlein Rowan Sloss Dalton Smith ID: 716074
Download Presentation The PPT/PDF document "Project BLISS Boundary Layer In-Situ Sen..." is the property of its rightful owner. Permission is granted to download and print the materials on this web site for personal, non-commercial use only, and to display it on your personal computer provided you do not modify the materials and that you retain all copyright notices contained in the materials. By downloading content from our website, you accept the terms of this agreement.
Slide1
Project BLISSBoundary Layer In-Situ Sensing System
Kyle CorkeyDevan CoronaGrant DavisNathaniel Keyek-Franssen
CustomerDr. Suzanna DienerNorthrop GrummanFaculty AdvisorDr. Donna Gerren
Robert LacyJohn SchenderleinRowan SlossDalton Smith
Team
1Slide2
Outline
Project OverviewMajor Changes and Status UpdateTest ReadinessDelivery SystemMeasurement SystemCloud Observation SystemBudget Update
2Slide3
Project Deliverables
3-Dimensional U-, V-, W- inertial wind vector data inside the measurement cylinderCloud base altitude and cloud footprint data above the measurement cylinder
Measurement Cylinder3Slide4
Levels of Success
4Delivery System
Measurement SystemCloud Observation SystemLevel 3:Execute flight plan following points spaced no more than 30 meters apart spanning the defined airspace in the 15 minute time limit with Measurement System onboard and collecting data Level 3:Deliver U-, V-, W- inertial wind velocity vector field
with temporal and spatial location for each measurement accurate to 1 m/s with a resolution of 0.1 m/s.Level 3:Deliver time-stamped cloud footprint images and cloud base altitude measurements at 1/4 Hz during the 15 minute test period.Slide5
Concept of Operations
100 m
200 m
Legend
Within Project Scope
NG model wind vector
Physical
W
ind
Vector
Wind Vector
of in-situ data
100 m
2
00 m
100 m
2
00 m
100 m
2
00 m
2
00 m
Airspace Test
Volume Subject
To Modeling
Northrop Grumman Wind Model Results
In-Situ Relative Wind Velocity Data Collection and Cloud Imaging
Inertial Wind from In-Situ Data and Cloud Base Altitude
Wind Vector and Cloud Data Used to Verify Northrop Grumman Model
5
100 mSlide6
Functional Block Diagram
Aircraft State & Wind
Pressure InertialU-,V-,W-Wind Vector Field
Post Processing AlgorithmNorthrop Grumman Wind Model
Delivery System
Pixhawk Flight Controller
Motor
GPS
Antenna
Electrical Power System
Power Module
Speed Controller
14.8V
Manual
Commands
5V
GPS Coordinates
Elevon
Servos
Serial Command
PWM
PWM
Measurement System
Pressure Transducers
Inertial Navigation System
Arduino Due
SD Card
Relative
Wind
Electrical Power System
5-Hole Probe
Thermistor
Aircraft State & Wind
Pressure
SPI
9V
Analog Voltage
Air
Pressure
Analog
The
M
easurement
System is packaged
in the
D
elivery
S
ystem
6
14.8VSlide7
Functional Block Diagram Continued
Vertical Camera
Internal SD Card
Cloud Observation System
Northrop Grumman Wind Model
Computer with Post Processing Algorithm
Vertical Camera
Battery
Internal SD Card
Left and Right
.RAW Images
Cloud Base Altitude
& Footprint
.RAW Image
.RAW Image
Power
Power
X
Cloud Base
Camera Field
of View
Camera Field
of View
Battery
7Slide8
Critical Project Elements
8
CPERequirementMotivationObtaining a COA4.1.1UAV cannot legally fly without a COADetermining Flight Path and maintaining it in flight1.1.1.1, 3.1To meet required spatial and temporal measurement resolutionRapid Prototyping 5-hole probe1.2Used to measure windCalibrated 5-hole probe1.2.3Need to geometrically calibrate the probe to accurately measure windAircraft State Knowledge
1.2.2Needed to convert relative wind to inertial windWind Post Processing Algorithm1.2.1Needed to convert relative wind to inertial wind.Cloud Observation Algorithm2.2.2Deliver cloud data within required error boundsSlide9
9
MSR
TRRDetailed Schedule up to TRRCalibration fell behind schedule due to issues with electrical and mechanical designHowever reducing the number of data points allowed us to get back on track and collect all necessary data
Only calibration algorithm remains and will be completed this weekAssembling the UAV was moved forward due to extra resources availableSlide10
10
TRR
UAV testing also moved forward Early flight testing allows for margin due to inclement weather and resources neededAllows for more resource allocation to Cloud Observation SystemSlide11
11
Detailed Test Schedule
All tests have built in margin due to unforeseen errors and availability of facilities and resourcesThis is especially true with all flight related tests. Each flight test below should only take 1 day.TRRSlide12
Delivery System
Test Overview
12
Purpose:
To transport the Measurement System through the measurement cylinder within the required 30 meter spatial resolution and 15 minute time limit
Status:
UAV is flight ready. Ground tests have been accomplished and flight tests can now commence.
Complete
In Progress
Scheduled in FutureSlide13
Manual Flight Test
13
Purpose:To validate that power consumption is adequate for flight time. Building block for autonomous flightRequirement:
3.1 – Delivery system must fly for 15 minutesMethod:Collect Power Consumption Data during climb and descent.Facilities:Table Mountain, Pilot James MackExpected Results:Power consumption during flight is similar to predicted. Verify battery will last for >20 minutes during data collection. Aircraft is shown to be airworthy.Impact:Aircraft is ready for autonomous flight testing.Slide14
Manual Flight Test Procedure
Procedures:Setup ground control station (GCS) in open area close to launch and landing sites.
Perform ground testing of control response prior to launch.With pilot ok, launch aircraft.Pilot performs helix climb and descent at flight velocities.Instruct pilot to land aircraft.14Slide15
Autonomous Flight Test
15
Purpose:Validate autopilot control of aircraft during ascent and descent during loiter.Requirement:
3.1 – Delivery system must fly for 15 minutesMethod:Record ascent and descent rates during autonomous flight.Facilities:Table Mountain, Pilot James MackExpected Results:Ascent and descent rates within 1 m/s of expected 1.66 m/s. Impact:
Aircraft is ready for flight plan testing.Slide16
Autonomous Flight Test Procedure
Procedures:Setup GCS in open area close to launch and landing sites.Perform ground testing of control
response prior to launch.Load box pattern and loiter waypoint to Pixhawk.With pilot ok, launch aircraft.Instruct pilot to transition to autonomous flightAfter flight path completion, instruct pilot to land aircraft.
16Slide17
Flight Path
Flight Path Test
17Purpose:Validate ability
to fly data collection flight path.Requirement:3.1 – Delivery system must fly measurement system to all measurement locations in the 15 minute requirementMethod:Command modified data collection flight path and record path and compare to SITL flight plan.Facilities:Table Mountain, Pilot James Mack
Expected Results:Vertical velocity as a function of time differs by no more than 1 m/s from SITL flight path, loiter radius remains constant.Impact:Aircraft is ready for data collection.Slide18
Flight Path Test Procedure
Procedures:Setup GCS in open area close to launch and landing sites.
Perform ground testing of control response prior to launch.Load modified flight path.Run through preflight checklist.With pilot ok, launch aircraft.Instruct pilot to transition to autonomous flightAfter flight path Completion, instruct pilot to land aircraft.
18Slide19
Measurement
System Test Overview
19
Purpose:
Verify the Measurement System will satisfy the 1 m/s accuracy of inertial wind measurements
Status:
INS test and calibration will be completed this week. Verification of calibration and flight testing with the measurement system is scheduled for next week. Everything is on schedule.
Complete
In Progress
Scheduled in FutureSlide20
Calibration of 5-hole probe
20
Purpose:Calibrate probe by creating matrix of reference pressure coefficientsRequirement:1.2.3 – Probe must be calibrated to determine relative wind
Method:Collect 5 hole pressure data at a 90° span of yaw and 180° span of roll anglesFacilities:ITLL Wind TunnelExpected Results:Total pressure measured by probe is within 20% of the wind tunnel total pressureImpact:Probe can now determine U-,V-,W- wind velocitySlide21
Calibration data collection
21
Procedures:
Set probe to -45°
yaw angle and zero roll Set wind tunnel to 25 m/s. Take data from BLISS Arduino and wind tunnel at the same time
Roll the probe
5
°
Set
wind tunnel to 25 m/s. Take data from BLISS
Arduino
and wind tunnel at the same time
Repeat
steps 3 and 4 until a roll angle of
180
°
is reached
Set
roll back to
0
°
.
Move yaw angle
5
°
Repeat
steps 2-6. Positive
45
°
is
the final yaw angle
Animation of probe moving in tunnel
Roll
YawSlide22
Calibration of 5-hole probe
Analytical prediction of pressure on the probe developed to give a baseline prediction of pressuresAssumes ideal flow around an ideal two dimensional cylinderComparison shows a similar trend between analytical and wind tunnel data. The trend shown by the data is less pronounced, possibly due to:Ideal 2D flow assumption vs. real 3D viscous flow Imperfect geometry of the probe tip
Angles beyond 30° are not shown because analytical prediction breaks down due to flow separationAnalytical solution becomes less accurate approaching 30° due to small flow separation22
52
134Probe tipSlide23
Calibration of 5-hole Probe
23
Pressure data meets expectation when rolling the probe at a fixed yaw anglePlotted data at 20° yaw, where flow has not separated from the probe tipPort 5 remains unchanged because its orientation relative to flow is fixed during rollPressure on ports 1-4 varies as the ports are exposed to more or less of the flow
5213
4Probe tipSlide24
Verification of Calibration
24
Purpose:Verify flow velocity components measured by probe match expected results from a known flow.Requirement:
1.2.3 – Probe must be calibrated to determine relative windMethod:Following Calibration Data Collection Procedure, Set probe at various yaw/roll orientations, measure pressuresFacilities:ITLL Wind TunnelExpected Results:Pressure data will correspond to orientation within 3.0° in alpha and 3.5° in beta
Impact:Probe can now determine U-,V-,W- wind velocity, ready for testing
β
V
∞
u
v
w
Probe tip
αSlide25
Purpose:
Verify the INS is
outputting values corresponding to known orientationRequirement:1.2.2 – Record necessary aircraft state dataMethod:Mount INS in moving vehicle, measure Euler angles, angular rates, GPS position and velocity in known orientationsExpected Results:GPS will display the route and velocity the car drives. The Euler angles will match up to output from potentiometers.Impact:INS is now ready for flight testingINS Test25Slide26
INS Test
26
Procedures:
Drive to the corner of Jay Road and Highway 119 and pull overVerify that GPS is functioningVerify Euler angles under static conditionsDrive down Highway 119 to Niwot on cruise controlVerify GPS position and velocity agree with route and speedometerRepeat routeVerify Euler angles correspond to readings from potentiometer accounting for elevation change in the roadSlide27
UAV Interface and Flight Testing
27
Purpose:Verify measurement system components measure expected values when UAV fliesRequirement:1.2 – 1 m/s accuracy in U-,V-,W- wind velocities
Method:Following the Manual Flight Test Procedure, fly delivery system with 5-hole probe/transducers, thermistor and INS collecting dataExpected Results:Measurement system reports wind data consistent with ground based weather station. Impact:Delivery and Measurement Systems are ready for final data collectionSlide28
Cloud Observation System Test Overview
28
Purpose:
Verify the COS can measure cloud base altitude within 10% error as defined by REQ. 2.2.3
Status:
All parts machined, cameras hacked; Small scale testing expected completion 3/13
Complete
In Progress
Scheduled in FutureSlide29
COS
Small Scale Testing
29PicturePurpose:Verify the COS meets 10% error requirement on ¼ scale testRequirement:2.2.3 – Less than 10% error for clouds up to 2 kmMethod:Set up system on angle
to view points on buildings that are up to 0.25 km away.Expected Results:Measurements will be within 10% error requirementImpact:Algorithms can be improved without special access to University facilities until results verified on a small scaleSlide30
COS
Small Scale Testing
30Camera Mount
Procedures:
Level and align COS brackets, tilt each same amount until building in view
Run imaging scripts on both cameras, run for 3 min
Process image sets
Compare COS measurements to actual measurementsSlide31
COS
Final Configuration Testing
31Purpose:Verify the COS meets 10% error requirement on a full scale testRequirement:2.2.3 – Less than 10% error for clouds up to 2 kmMethod:Measure cloud base altitude from top of Duane Physics, compare results with CU ATOC Ceilometer
Facilities: Roof of Duane Physics Building Expected Results:COS altitude measurements are within 10% of ATOC ceilometer measurementsImpact:COS is verified to measure cloud base altitude, ready for final data collectionSlide32
COS
Final Configuration Testing
32
Procedures:
Test on a day with cumulous clouds
Setup COS on roof of physics building, align mounts and level
Start imaging scripts, run for 3 min
Process image sets
Compare COS measurements ceilometer dataSlide33
COS
Final Configuration Testing
33
up to 2km40m
Compute distance measurement with COS
COS measurements expected to be within 10% of ceilometer reading
ATOC
Ceilometer
Bliss COSSlide34
Budget Update
34
BudgetedActualUnder(Over)Delivery System $ 1,265.00 $ 1,061.62 $ 203.38
Measurement System $ 2,562.47 $ 2,412.90 $ 149.57 Cloud System
$ 355.97 $ 241.90 $ 114.07
Shipping
$
500.00
$ 73.10
$ 426.90
Additional Expenses
-
$
491.47
$
-491.47
Margin
$
292
$
711.90
$ 419
Estimated Expenses at time of CDR: $4708.29
Total Expenditures thus far: ~ $4300
Remaining Margin: ~ $700
Notable savings from shipping budget allocation
Many unexpected small purchases have led to considerable additional spendingSlide35
Budget Update
35
Future ExpendituresExpenses To DateSlide36
Summary
Delivery System status:Ground tests have been completed.UAV is flight ready and can begin tests when James Mack is available and weather is good.Measurement System status:All calibration data has been taken. Algorithm for the data sets is in progress and on schedule.
INS test to be completed this week.Cloud Observation System status:Cameras have been hacked and the mounts have been assembled.Final distancing algorithm is in progress and the CU ATOC ceilometer validation test is scheduled in 3 weeks.The margin in the budget is currently at $712 and a final planned margin is $46236Slide37
Acknowledgements
We would like to thank all of the PAB, our advisor Dr. Gerren, our customer Dr. Diener from Northrop Grumman, Trudy Schwartz, Bobby Hodgkinson, Matt Rhode, James Mack, and Gabe LoDolce for all their help in preparation for this TRR.
37Slide38
Questions
?
38Slide39
Back Up Slides
39Slide40
Motivation
Northrop Grumman Atmospheric Boundary Layer Model VerificationBoundary layer inertial wind data, cloud base altitude used in verification Boundary Layer Wind Model Applications:Airborne pollution monitoringPrediction of forest fire advances
Facilitating soldiers in battle40Slide41
Experimental
Setup
100 m
2
00 m
≤ 30 m
BLISS Measurement
and Delivery System
Data points –
Spaced at most 30m radially in 3D space
Legend
Physical Wind Velocity
V
ector
F
ield (u-,v-,w-)
Cloud observations
constrained to
the measurement cylinder’s vertical projection
Atmospheric clouds located high above test volume
In-Situ relative wind velocity data collection
Cloud
O
bservation
S
ystem stereovision
c
ameras
41Slide42
Levels of Success
42Level 1:Certified to operate
in an airspace defined as a cylinder with a 100 meter radius and 200 meter height above ground level.Level 2:Executes flight plan following points spaced no more than 30 meters apart spanning the defined airspace in the 15 minute time limit. Level 3:Execute level 2 flight plan with Measurement System onboard and collecting data Delivery SystemMotivation: The measurement system needs to be transported through the measurement cylinder to meet special and temporal requirements. Slide43
Levels of Success
43Level 1:Wind measurement system collects relative wind data with
resolution of 0.1 meter/second. Level 2:Post-process the relative wind data from a ground test to compute the U, V, W inertial wind velocity vector components.Measurement SystemMotivation: Provide Northrop Grumman with data precise enough to verify a boundary layer wind model.
Level 3:Deliver U-, V-, W- inertial wind velocity vector field with temporal and spatial location for each measurement accurate to 1 m/s with a resolution of 0.1 m/s.Slide44
Levels of Success
44Level 1:I
mage the cloud footprint above a 100 meter radius cylinder at 1/4 Hz for a 15 minute period. Level 2:System is tested in full scale to take distance measurement with less than 10% error up to 2kmLevel 3:Deliver time-stamped cloud footprint images and cloud base altitude measurements at 1/4 Hz during the 15 minute test period.Cloud Observation SystemMotivation: Provide Northrop Grumman with cloud observation data to correlate with wind vector field measurements.Slide45
Resource Allocation
45Slide46
Ground Testing
Preliminary and preflight ground testing conducted to assure aircraft response to manual and autopilot control.
Will test elevon directional response to control input and prop rotational direction.Ground testing ensures readiness for flight testing.46Slide47
Ground Test Procedure
Arm Aircraft Control Surfaces in Manual ModeInput Roll Command and Record Elevon ResponseInput Pitch Command and Record Elevon Response.Switch to ALTCTL ModePitch Aircraft and Record Elevon Deflection. Note: Deflection will be opposite motion to restore aircraft to level flight.
Roll Aircraft and Record Elevon Deflection.47Slide48
Range Test
Conducted to verify maximum radio range is greater than the maximum distance BLISS DS will travel from the ground station.Will be conducted on Kittredge Field.Range test prepares for flight readiness.
48Slide49
Range Test Procedure
Setup GCS on North East Corner of Kittredge Field.Disconnect Motor from ESC.Arm Aircraft.Have Test Assistant Carry Aircraft Away From GCS while inputting RC control to elevons every 5 seconds.When Test Assistant is unable to observe RC input return to GCS.If Link is Lost from GCS to Aircraft at Any Point, Measure that Distance as Max Range.
49Slide50
Preflight Checklist
****** Airframe ******☐ ☐ Ensure fuselage is fully assembled, screws tightened, comm antenna bends forward☐ ☐ Check Prop For Damage and Loose Bolts****** Auto-Pilot ******☐ ☐ Turn on Aircraft and start Qgroundcontrol☐ ☐ Connect Aircraft to Qgroundcontrol
☐ ☐ Verify Battery Level Acceptable for Flight☐ ☐ Ensure Data and Comm Link☐ ☐ Ensure Correct Airframe Configuration☐ ☐ Ensure RC Remote calibrated and assigned correctly☐ ☐ Ensure Sensors are connected and calibrated☐ ☐ Verify Mission Waypoints☐ ☐ Save Mission Waypoints and Gains☐ ☐ Verify GPS Lock☐ ☐ Verify Manual Controls☐ ☐ Check pitot port by blowing into it and seeing the airspeed response 50****** Prelaunch *********☐ ☐ If using Autonomous Takeoff ensure waypoint reachable and loiter waypoint exists
☐ ☐ Arm Control Surfaces☐ ☐ Recheck control surface deflections in manual and ALTCTL☐ ☐ Load vehicle on catapult☐ ☐ Enter Manual Mode
☐ ☐ Signal ready to backup pilot; if autonomous launch, pilot will switch to Auto Mode; clear for launch****** Pre-Autonomous Flight Checks ******
☐ ☐ 15 s after liftoff, verify Flying mode
☐ ☐ Verify that aircraft heading displays correctly and that GPS is locked
☐ ☐ Track first autonomous waypoint (usually home loiter)
☐ ☐ Inform pilot of expected autonomous behavior
☐ ☐ Direct pilot to desired handoff flight path and authorize handoff to autonomous flightSlide51
Flight Plan Simulation
Skywalker X8 has been implemented into Software in the Loop (SITL)4 Helix Flight Path can be completed without stalling51
VariableMax Value in SITLFlight Time12.5 MinutesPitch Angle11°Roll Angle
31°Slide52
Autopilot Flight Plan Design
52
Switch to Autopilot ControlEnter Ascending Helix 1Complete
Ascending Helix 1Enter Descending Helix 1Slide53
INS Test Stand Drawing
53Slide54
Wind Tunnel Calibration Stand Drawings
54Slide55
Wind Tunnel Calibration Stand Drawings
55Slide56
Wind Tunnel Calibration Stand Drawings
56Slide57
Wind Tunnel Calibration Stand Drawings
57Slide58
Wind Tunnel Calibration Stand Drawings
58Slide59
Wind Tunnel Calibration Stand Drawings
59Slide60
Wind Tunnel Calibration Stand Drawings
60Slide61
Measurement System Test - completed
Wind tunnel characterization test completed and data presented in MSRElectrical component verification completed:Bench top testing of pressure transducersWind tunnel testing of incorporated transducers, probe, and tubingCalibration stand function testing completed:
Stand fit with wind tunnel baseProbe range of motionData verification of integrated system61Slide62
Port orientation to the flow
62
ψ
Flow
Lower Pressure
Higher Pressure
5
2
1
3
4
Probe tip
5-hole probeSlide63
Purpose of Calibration
Calibration is necessary to determine the unknowns of the flowAngularityTotal PressureCalibration creates a dataset for comparison to determine unknownsThe five pressures measured on the probe are unique to a certain total pressure and angularity
Trend fitting matches the 5 pressures to the most similar form the calibration set to determine unknowns63Slide64
Measurement System: Pitot Tubes –Calibration
The 5 pressure readings from the probe (one from each port) can be related to the orientation of the probe through non-dimensional coefficientsTo do this:Independent non-dimensional coefficients are calculated as a function of the 5 recorded pressure values from the probe
dependent non-dimensional coefficients are calculated as functions of total pressure and static pressure. Coefficients are stored in a matrix.During testing, the independent coefficients act as look-up tables, which allow determination of orientation, total pressure and static pressure.64
Dependent coefficients
Independent coefficientsSlide65
Angularity Test
At zero yaw angle, rolling the probe would show if there is an angularity in the wind tunnel
The trend shown is not consistent with an angularity, but can be attributed to imperfect mounting of the probe65Slide66
INS Factory Calibration
All sensors (accelerometers, gyroscopes, magnetometers) are calibrated for axis misalignment, scale factor, and bias at the manufacturer. Calibration is stored onboard and applied in real time during operationThe performance specifications for the IMU and GPS are validated through ground and air vehicle testing against high-end fiber optic gyro based INS units at the manufacturer
66Slide67
67Slide68
68