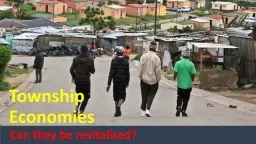
/
Why to work with your city (or township) and the bigger context facing school district Why to work with your city (or township) and the bigger context facing school district

Why to work with your city (or township) and the bigger context facing school district - PowerPoint Presentation

natalia-silvester
natalia-silvester . @natalia-silvester
Follow
342 views
Uploaded On 2019-11-08

Why to work with your city (or township) and the bigger context facing school district - PPT Presentation

Why to work with your city or township and the bigger context facing school district governments Dr Eric Scorsone MSUE Center for Local Government Finance and Policy Michigan State University Federal realities ID: 764827

fund tax 000 act tax fund act 000 revenue school 2000 cooperation 1999 public 2017 general taxes 2014 transfer

Share:

Link:

Embed:

Download Presentation from below link

Download Presentation The PPT/PDF document "Why to work with your city (or township)..." is the property of its rightful owner. Permission is granted to download and print the materials on this web site for personal, non-commercial use only, and to display it on your personal computer provided you do not modify the materials and that you retain all copyright notices contained in the materials. By downloading content from our website, you accept the terms of this agreement.


Presentation Transcript

Why to work with your city (or township) and the bigger context facing school district governments Dr. Eric Scorsone MSUE Center for Local Government Finance and Policy Michigan State University

Federal realities

Government Share of the Economy (% of GDP)

U.S. Spending on Education (% of GDP)

Federal Budget Projected

Michigan budget realities

Michigan General Fund 0 1967-68 1975-76 1983-84 1991-92 1999-2000 2007-08 2015-16 1963-64 1971-72 1979-80 1987-88 1995-96 2003-04 2011-12 2019-20 Fiscal Year So urc e: U .S . D ept. of Co m m erce , M ich igan De pt. of Tre asu ry, and May 201 8 C on sens us Estim ate s In 2010 Dollars Actual $2,000 FY 20 17-1 8, 20 18-1 9, and 20 19-2 0 es tim ate d $6,000     $4,000 Ongoing General Fund Revenue Nominal Revenue in FY 20 Below FY 00 Level; Adj. for Inflation, the FY 68 Level $16,000     $14,000     $12,000     $10,000     $8,000

GF and SAF Net Revenue '96-'97 '98-'99 2000-01 '02-'03 '04-'05 '06-07 '08-09 '10-11 '12-13 '14-15 '16-17 '18-19 '95-'96 '97-'98 '99-2000 '01-'02 '03-'04 '05-06 '07-08 '09-10 '11-12 '13-14 '15-16 '17-18 '19-20 Fiscal Year -15.0% -12. 1% -6.0%   -9.0%   -12.0% -3.7% -3.3% May 2018 Consensus Est. -2.1% -3.0% -1.4% -0.1% -0.0% 0.3% 1.8% 1.2% 0.7% 0.5% 0.7% 1.6% 3.0% 3.0% 3.4% 3.6% 3.5% 4.8% 4.7% 6.0% 6.1% 7.0% 6.5% 6.7% 8.5% 9.5% 9.0% (Annual Percentage Change) 15.0%   12.0% Change in General Fund/General Purpose and School Aid Fund Net Revenue

Lottery 7.0% $950.0 Casino Tax 0.8% $115.0 State Education Tax 15.6% $2,121.7 Industrial/Comm. Facilities Tax 0.3% $39.0 Real Estate Transfer Tax 2.5% $336.5 Liquor Tax 0.4% $56.6 Other taxes 0.2% $28.3 Tobacco taxes 2.6% $346.7 Use Tax 4.3% $580.5 Sales Tax 44.5% $6,047.0 Total (All Earmarked Taxes Plus Lottery): $13,574.4 How is SAF paid for?

DETAIL ON MAJOR CHANGES IN TAX EXPENDITURES (millions of dollars)     FY 1999-2000   FY 2011-12 $ Change FY 1999-2000 to FY 2011-12   FY 2017-18 $ Change FY 2011-12 to FY 2017-18 Consumption Taxes           Food $860.0 $1,220.2 $360.2 $1,305.5$85.3Industrial Processing660.0920.0260.01,411.0 491.0Prescription Drugs242.0536.3294.3727.6191.3Services4,392.010,357.25,965.213,292.12,934.9Individual Income Taxes     Adjustments to Income1,600.03,351.71,751.74,499.31,147.5Homestead Prop. Tax Credit 471.0 831.1360.1 524.8 (306.3)Personal Exemption987.01,173.7186.71,404.4230.7Earned Income Tax Credit0.0360.0360.0123.3(236.7)All Other Tax Expenditures4,859.47,044.22,184.86,200.3 (843.9)Total Tax Expenditures$14,071.4$25,794.4$11,723.0 $29,488.2 3,693.8Tax Expenditures

Source: Department of Technology, Management, and Budget, and May 2018 Consensus Revenue Estimates FY '17-18 FY '13-'14 FY '19-20 FY '15-16 FY '11-'12 FY '09-'10 FY '05-'06 FY '97-98 FY' 07-'08 FY '03-'04 FY 1999-2000 FY '01-'02 -$12.0 -$9.0 -$9.8 -$10.0 -$9.2 -$8.7 -$8.5 -$8.1 -$7.8 -$7.6 -$8.0 -$8.0 -$6.5 -$5.6 -$6.0 -$5.2 -$5.3 -$4.7 -$4.9 -$4. -$4. -$4.2 -$3. -$4.0 -$2.4 -$2.0 -$0.6 $0.0 $0.2 0 $2.0 Constitutional Revenue Limit Constitutional Revenue Limit

BUDGET AND ECONOMIC STABILIZATION FUND TRANSFERS, EARNINGS, AND FUND BALANCE FY 1998-99 TO FY 2018-19 INITIAL APPROPRIATIONS (millions of dollars)   Pay-I n     Fiscal Year Trust Fund Act a) Other Interest Earned Pay-Out Fund Balance 1998-99 $0.0 $244.4 $51.2 $73.7 $1,222.5 1999-00 0.0 100.0 73.9132.01,264.4 2000-010.00.066.7337.0994.22001-020.00.020.8869.8145.22002-030.09.11.8156.10.02003-040.081.30.00.081.32004-050.0 0.02.0 81.32.0 2005-06 0.00.00.00.02.02006-070.00.00.10.02.12007-080.00.00.10.02.2 2008-090.00.00.00.0 2.2 2009-100.00.00.00.02.22010-11 0.00.00.0 0.02.22011-12 0.0362.70.2 0.0365.12012-130.0140.00.50.0 505.62013-14b)0.075.00.4 194.8 386.2 2014-15 17.5 94.0 0.4 0.0 498.1 2015-16 17.5 95.0 1.8 0.0 612.4 2016-17 17.5 75.0 5.1 0.0 710.0 Enacted Deposits with Estimated Interest Earnings Fund Balance: 2017-18c) 17.5 265.0 10.3 0.0 1002.8 2018-19 17.5 0.0 19.6 0.0 1039.9 a) PA 186 of 2014 amended the Trust Fund Act to authorize the deposit of $17.5 million of tobacco settlement revenue to the BSF annually from FY 2014-15 to FY 2034-35 to repay the withdrawal related to the Detroit bankruptcy. b) Pay-in was appropriated in Public Act 59 of 2013. Pay-out is the transfer of $194.8 million in FY 2013-14 per PA 188 of 2014 from the BSF to the Settlement Administration Fund related to the Detroit bankruptcy. c) PA 107 of 2017 ($150.0 million) and PA 207 of 2018 ($115.0 million). State Stabilization Fund

Funding challenges: Cities and Schools

Shared services and cooperation

How to work with Cities/Townships/Counties Urban cooperation act Revised school code Intergovernmental transfer of powers act

Comparison of Goals & Objectives City/township Public safety Land use planning and zoning Healthy community More control of own money and taxes Ambiguous goal setting and multiple services School Primary focus on student achievement Student health and welfare MDE/FDE – standardized testing

Key themes for successful cooperation Leadership Transparency Clear goals Reciprocity Measureable results trust

Examples - Spending Building and grounds maintenance Information technology Purchasing Recreational and athletic facilities

Legal Discussion

General power school district cooperation May enter into agreements or cooperative arrangements with other entities , public or private, as part of performing functions of school district Exempt from urban cooperation act

Urban Cooperation Act of 1967 An act for interlocal public agency agreements Public agency means local governments, schools Must share the power in common; lots of back office enterprises

Intergovernmental Transfer of powers Act 8 of 1967 Includes school district and ISD Transfer functions or responsibilities (buy-sell arrangement) Joint board or commission to oversee contract may be setup

Examples from other states

New Jersey Survey 2014 and 2015 Most common shared services Recreation and field use Walking route safety Building operations and maintenance Other growing areas – security, technology and grant writing 73% of respondents reported savings from shared services Comments Frequent meetings Open lines of communication Shared advocacy and joint planning Pride in students Respect boundaries

Georgia Survey of case studies 2017 Vocational education with fire department in HS Truancy panels School siting and land use planning

Thank you! Questions?