/
Youth Treatment Bulge in South Africa Youth Treatment Bulge in South Africa

Youth Treatment Bulge in South Africa - PowerPoint Presentation

natalia-silvester
natalia-silvester . @natalia-silvester
Follow
385 views
Uploaded On 2017-09-11

Youth Treatment Bulge in South Africa - PPT Presentation

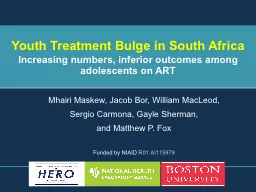
Increasing numbers inferior outcomes among adolescents on ART Mhairi Maskew Jacob Bor William MacLeod Sergio Carmona Gayle Sherman and Matthew P Fox Funded by NIAID R01 AI115979 B ID: 587084

care hiv youth art hiv care art youth years bulge adolescents 2014 treatment numbers nhls national suppression cd4 2012 981 linkage data

Share:

Link:

Embed:

Download Presentation from below link

Download Presentation The PPT/PDF document "Youth Treatment Bulge in South Africa" is the property of its rightful owner. Permission is granted to download and print the materials on this web site for personal, non-commercial use only, and to display it on your personal computer provided you do not modify the materials and that you retain all copyright notices contained in the materials. By downloading content from our website, you accept the terms of this agreement.


Presentation Transcript

Slide1

Youth Treatment Bulge in South AfricaIncreasing numbers, inferior outcomes among adolescents on ART

Mhairi Maskew, Jacob Bor, William MacLeod, Sergio Carmona, Gayle Sherman, and Matthew P. Fox Funded by NIAID R01 AI115979Slide2

Background

Globally 2 million HIV-infected 10-19 yr olds80% live in sub-Saharan Africa 1Rising adolescent numbers attributed toLong-term survival of

perinatally-infected children on ART

Incident infectionsNotably girls 15-19 years

1

UNICEF

, 2014

http

://

data.unicef.org

/

hiv

-aids/adolescents-young-

people.htmlSlide3

ChallengesA key population with different needs

Developmental and social changesTransition to adult HIV careEvidence of high attrition and low viral suppression (Evans 2013, Nglazi

2012, Lamb 2014)

Evidence needed to plan and care for HIV-infected adolescents at a health-systems levelNo nationally-representative adolescent cohortSlide4

Methods

NHLS National HIV cohort developed from South Africa’s National Health Laboratory Service (NHLS) database, using record linkage techniquesM. Fox – System wide retention (SR4, 14h30)J. Bor – District prevalence unsuppressed HIV (SR5, 14h30)Analyzed all public sector viral load and CD4 tests

nationally since

2004 Included all patients aged ≤20 years at test date Slide5

NHLS National HIV Cohort: Youth profile

Overall, analyzed 3,6 million blood tests between 2004 and 2014 Represents

~ 1 million patients

55%

4

5%Slide6

Cascade of HIV CareSlide7

≥1

CD4 count or VL result ever

1,036,257Slide8

Gender distribution at entry to

HIV carePatients entering care in 2014Slide9

≥1 VL result

476,674Slide10

Emergence of youth treatment bulgeSlide11

Emergence of youth treatment bulgeSlide12

Emergence of youth treatment bulgeSlide13

Rising numbers on ART

1-4 years5-9 years10-14 years15-19 years2004-07

27,157 (35%)

24,921 (32%)8,854 (11%)

5,904 (8%)2008-1188,391 (26%)110,737 (33%)72,774 (22%)

34,981 (10%)

2012-14

89,530

(17%)

155,163 (30%)

141,945 (28%)

96,042 (19%)Slide14

Rising numbers on ART

1-4 years5-9 years10-14 years15-19 years2004-07

27,157 (35%)

24,921 (32%)8,854 (11%)

5,904 (8%)2008-1188,391 (26%)110,737 (33%)72,774 (22%)

34,981 (10%)

2012-14

89,530

(17%)

155,163 (30%)

141,945 (28%)

96,042 (19%)Slide15

Rising numbers on ART

1-4 years5-9 years10-14 years15-19 years2004-07

27,157 (35%)

24,921 (32%)8,854 (11%)

5,904 (8%)2008-1188,391 (26%)110,737 (33%)72,774 (22%)

34,981 (10%)

2012-14

89,530

(17%)

155,163 (30%)

141,945 (28%)

96,042 (19%)Slide16

≥1 VL or CD4 since 1 Jan 2014

228,169

VL

result ≤1000 copies/mL

148,180Slide17

VL suppression by age category

Age categoryn (%)

Currently

suppressed

Crude RR* (95% CI)

5-9 years

41717

(74%)

Reference

10-14 years

41839

(69%)

0.93 (0.93-0.94)

15-19 years

29123

(62%)

0.84 (0.84-0.85)

*RR = relative riskSlide18

VL suppression by genderSlide19

LimitationsVL/CD4 data proxy for cascade milestones

Some misclassification possibleImputation of ART start dates using other lab data (Poster 654)Record linkage may lead to some errorsValidated against manually-matched datasetBut linkage for infants requires further optimizationSlide20

Summary of findings

Success of PMTCT and pediatric ART led to a demographic “youth bulge” receiving ARTMembers of this youth treatment bulge now adolescents and transitioning to adult care Lower

viral suppression among

older adolescentsSlide21

Implications

Urgent need to consider this bulge for planning and improving care for the vulnerable and growing population of adolescents on ARTLaboratory datasets represent important tool for national monitoring and planningSlide22

AcknowledgmentsPatients and care providers in national programNational Department of Health

Staff at the NHLS; Sue Candy (NHLS CDW)Research colleagues at Boston University School of Public Health and HE2ROFundersNIH (NIAID, NIMH)PEPFARUSAID