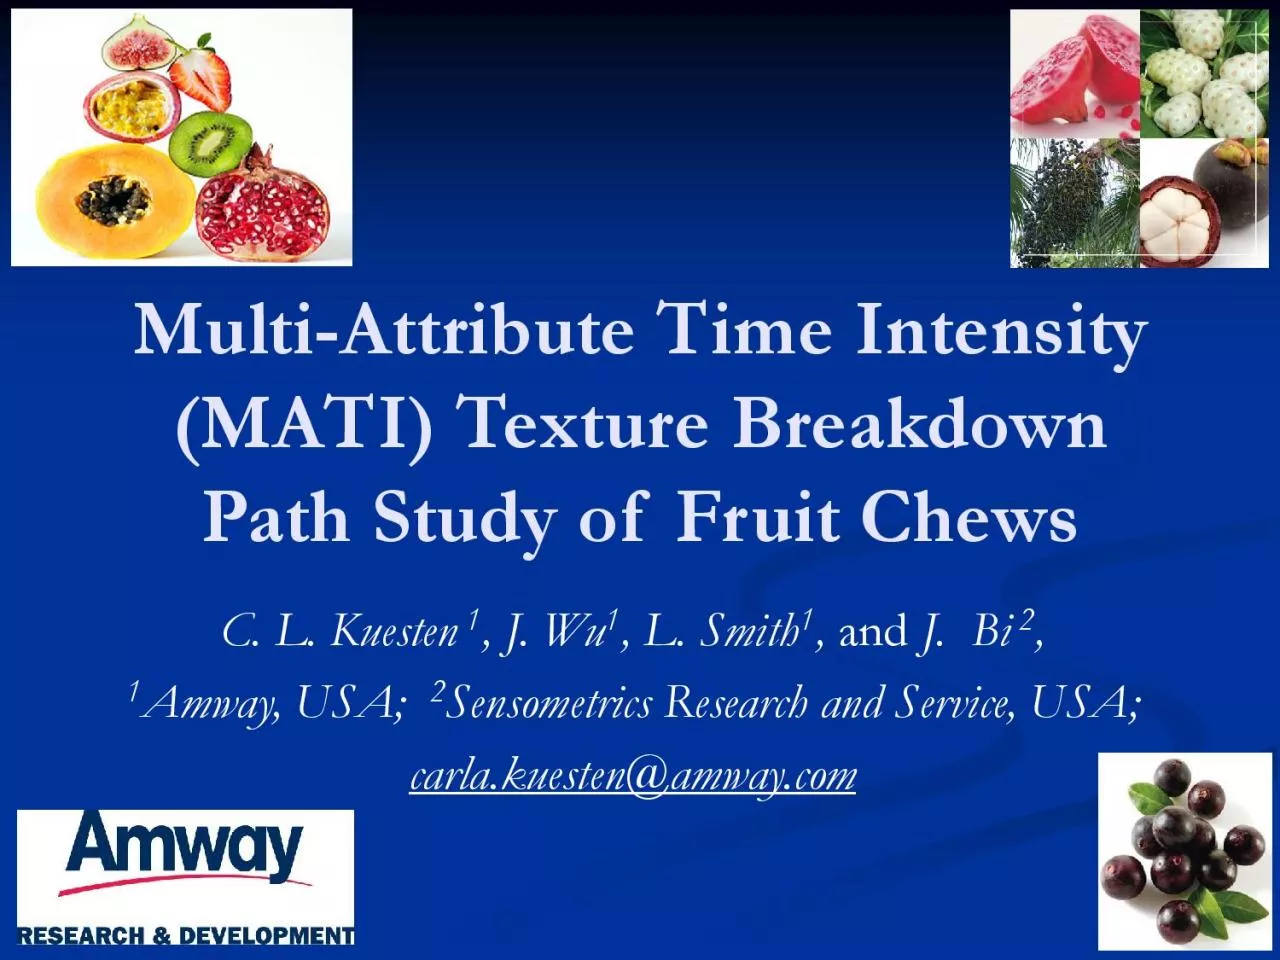
/
MATI Texture Breakdown Path Study of Fruit Chews J WuJ  BiAmway USA  S MATI Texture Breakdown Path Study of Fruit Chews J WuJ  BiAmway USA  S

MATI Texture Breakdown Path Study of Fruit Chews J WuJ BiAmway USA S - PDF document

norah
norah . @norah
Follow
342 views
Uploaded On 2021-08-05

MATI Texture Breakdown Path Study of Fruit Chews J WuJ BiAmway USA S - PPT Presentation

Background Challenge Functional Fruit Chewsa healthy snackFunctional IngredientsOrganically grown superfruitsTaste challenge Texture challenge chalky fibrous gritty particulatesBoth flavor and ID: 857043

0102030405060 020406080100 seconds 020406080100120 020406080100 0102030405060 020406080100120 seconds prototype 050100150 chew 01020304050 0204060 descriptive panel candy 020406080100time data findings

Share:

Link:

Embed:

Download Presentation from below link

Download Pdf The PPT/PDF document "MATI Texture Breakdown Path Study of Fru..." is the property of its rightful owner. Permission is granted to download and print the materials on this web site for personal, non-commercial use only, and to display it on your personal computer provided you do not modify the materials and that you retain all copyright notices contained in the materials. By downloading content from our website, you accept the terms of this agreement.


Presentation Transcript

1 (MATI) Texture Breakdown Path Study of F
(MATI) Texture Breakdown Path Study of Fruit Chews, J. WuJ. BiAmway, USA; Sensometrics Research and Service, USA;carla.kuesten@amway.com Background Challenge Functional Fruit Chewsa healthy snackFunctional IngredientsOrganically grown superfruitsTaste challenge –Texture challenge chalky, fibrous, gritty particulatesBoth flavor and texture are concerns, however, primary focus in this texture during chew down of the fruit chews. Introduction Multi-Attribute Time Intensity Intermittent measurementRepeated cycles through attributes—at AdvantagesRapid collection -multiple attributesAbility to capture events over timeDisadvantagesLimited data and ‘missed’ momentsTraditional Time-Intensity Single attribute at a timeContinuous measurementOne sequence/runAdvantagesThorough evaluation for a single Consistent attention by panelist to DisadvantagesTime-intensiveMATI offers advantages for studying the Texture Breakdown Path.Hutchings and Lillford (1988) in their Discussion Paper

2 on THE PERCEPTION OF FOOD TEXTURE-THE PH
on THE PERCEPTION OF FOOD TEXTURE-THE PHILOSOPHY OF THE BREAKDOWN PATHemphasizes that texture perception is a dynamic sensory monitor of changes made to a foodand postulates a general three dimensional model using “Degree of Structure“, “Degree of Lubrication” and “Time” Objectives MATIMethod ObjectivesExplore capture of responses using a computerized Access Visual Basic program that ‘paces’ respondents through multiple attributes and cycles Texture Breakdown PathContinuous line scale attributesDynamic Temporal CATAAssess enhanced MATI approach with Temporal CATATrained descriptive panelists (MATI vs. traditional profiling)Adult consumers (MATI vs. traditional survey)Expand analytics applied to MATI dataProduct ObjectivesRelate descriptive and consumer results to understand consumer liking as a function of descriptive attributes throughout consumption experienceGuide flavor and texture optimization for functional fruit chews Methodology Panels Panels DescriptivePanel

3 Traditional Profilingmultiple reps multi
Traditional Profilingmultiple reps multiple reps Consumer Traditional Survey1 rep 1 rep Methodology Samples For this study presentation,#C1 --Cherry Chew Candy#C2 --Chocolate Chew Candy#P1 --Prototype 1#P2 --Prototype 2NumberCodeFlavorExample1125chocolate2194cherry3305multi-fruit4311multi-fruit5319cherry6425berry7491chocolate8498cherry9550multi-fruit10582cherry11608cherry12672multi-fruit13691berry14726chocolate15773multi-fruit16892cherry17924multi-fruit18938berry Methodology Descriptive PanelScorecard Traditional Profiling Unblended 0 1 2 3 4 5 6 7 8 9 10 11 12 13 14 15FlavorAroma and FlavorOverall Aroma IntensityOverall Flavor IntensityIdentifying Flavor Intensity StrongSweet AromaticsBalance/Blend StrongStrongStrongOverall Fruit Strong DescriptorsRecorded StrongSweet Strong StrongOverall Off-notes 15 Sec Aftertaste StrongAftertaste Strong StrongSurface PropertiesFirst Bite MoreMoreCohesivenessFracturability MoreMoreAdhesiveness MoreChew Down MoreDissolvability Mo

4 reMoistness of MassParticle Size BiggerR
reMoistness of MassParticle Size BiggerRoughness of Mass MoreAdhesiveness MoreCohesiveness of MassAmount of grit More MoreResidualToothpack/Toothstick MoreMoreChalky MouthcoatOily Mouthcoat MoreLoose Particles MoreTexture Methodology Descriptive PanelScorecard StageLine Scale0-150 pointTimerSurface PropertiesSmoothRoughPowdery/ChalkyGrittyWaxyOilyFirst BiteHardnessCohesivenessMoistness of MassAwareness of ParticulatesChew DownSTARTBreak DownSwallowMoistness of MassSTARTLoose ParticlesResidual (60 seconds)FREEAstringentPowdery/ChalkyGrittyWaxyOilyUniform BiteDenseToothpullCATAFruitSweetSourBitterOff-NotesDeformableSpringyFruitSweetSourBitterOff-NotesSmoothRoughThinThickThroat Irritation Methodology Descriptive PanelData Collection Methodology Descriptive PanelData Collection Methodology Descriptive PanelData Collection Methodology Descriptive PanelData Collection Methodology Descriptive PanelData Collection Methodology SurveyLIKES

5 /DISLIKESJARTASTE AFTER SWALLOWING9-poin
/DISLIKESJARTASTE AFTER SWALLOWING9-point HEDONICAPPEARANCEPleasantness of tasteOverall AppearanceColor of the ChewOverall LikingFLAVORAPPROPRIATE FRUIT FLAVOROPEN-ENDSOverall Fruit FlavorWhat did you LIKE about this sample?SweetEXPECTATIONSWhat did you DISLIKE about this sample?Sour9-point HEDONICTEXTUREAGREE/DISAGREEOverall FlavorChewinessThis chew looks natural.Overall TextureRate sample dissolvesThis chew tastes great.Amount of fruit particlesThis chew tastes natural.SmoothnessThis chew tastes delicious.This chew tastes fresh.AFTER SWALLOWINGFlavor Intensity Methodology ConsumerDuring ChewingAfter Dissolved10 male/10 femaleOverall Liking of TexturePleasantness of Feeling After SwallowingOverall Liking of FlavorPleasantness of Taste After Swallowing Methodology Consumer PanelData Collection Methodology Consumer PanelData Collection Methodology Consumer panel orientation to MATI is key.Suggest….Explaining the data collection techniqueProviding an unders

6 tanding of the interest in collecting th
tanding of the interest in collecting their responses over timeOffer practice with a warm-up sampleElse…you getLack of attention over timeLate/tardy/procastinatingresponders Methodology Statistical Analysis Curves were analyzed using Functional Data Analysis (FDA)were used to smooth the MATI curvesCATA observed proportionswere used to produce a functional curve at each time pointirst and second derivatives of the curveswere producedusing ‘fda’. The derivatives represent respectively velocity and acceleration of curves.Functional Analysis of Variance (fANOVA) permutation F-tests were used to compare mean curvesused to summarize curves into “principal curves”MANOVA based on FPC scores K-means Cluster Analysisof FPC scores was used to show Functional Data Analysis (FDA) a relatively new branch of advanced statistics is highlighted as a technique applicable for MATI data. Methodology Statistical Analysis Other statistics applied include:TI curve parameters were estimate

7 d using the and ‘integrate’ program (for
d using the and ‘integrate’ program (for estimating area) in S-Plus. The parameters include:Average dissolution time (seconds)Imax –maximum intensityTmax-Time (seconds) to reach maximum intensityAUC –area under the curveArea before and after ImaxParameters were evaluated using ANOVA Groups of curves were evaluated using HANOVA(adaptive ANOVA for high-dimensional data curves)Cochran’s Q test to compare sample CATA maximum response probabilitiesICC –intra-class correlation coefficientIndex and framework to evaluate panel and panelist performance for consistency, sensitivity (reliability and validity measures)ICC can be calculated from the Imax data or the first FPC scores.MICC –multivariate intra-class correlation coefficient Used to assess inter-relationships among the different attributesOther advanced statistics are also shown for MATI data analysis.NOTE: References for statistical methods applied to descriptive MATI and traditional profiling data are provided at the end. Metho

8 dology Statistical Analysis Tradi
dology Statistical Analysis Traditional SurveyANOVAand multiple comparisons for liking dataAdaptive penalty analysisfor JAR dataRelative importance of JAR attributesProportional odds model (POM)for ordinal categorical data (e.g., purchase intent, expectation, aftertaste, etc)Agresti, A. (2009). Analysis of Ordinal Categorical Data, 2nd Edition, New York, Wiley.Agresti, A. (2013). Categorical Data Analysis, 3rd Edition, New York, Wiley.Bi, J. (2012). Invited Review: A review of statistical methods for determination of relative importance of correlated predictors and identification of drivers of consumer liking. Journal of Sensory Studies 27, 87-101. Grömping, U. (2006). Relative importance for linear regression in R: The package relaimpo. Journal of Statistical Software, 17, Issue 1, 1-27.Grömping, U. (2007). Relative importance in linear regression based on variance decomposition. The American Statistician, 61, 139-147.SAS (2001). JMP Statistics and Graphic

9 s Guide, version4, Cary, NC, USA.McCulla
s Guide, version4, Cary, NC, USA.McCullagh, P. (1980). Regression models for ordinal data (with discussion). J. R. Statist. Soc. B 42, 109-42.VenablesW.N. and Ripley, B.D. (2002). Modern Applied Statistics in S. 4th edition. Springer-Verlag, New York. The traditional consumer survey data was analyzed as follows: Detailed Findings Descriptive Panel Continuous Attribute Data Seconds Attribute Rating Surface PropertiesFirst BiteChewdownBreakdownSwallow & Residual60 secs Hardness Cohesiveness Moistness of Mass Awareness of Particles Moistness Mouthfeel Loose Particles Detailed Findings Panel Descriptive #C1 --Cherry Chew Candy#C2 --Chocolate Chew Candy#P1 --Prototype 1#P2 --Prototype 2 0102030405060Time (seconds) 01020304050Weighted Rating MeanMoistness of Mass 0102030405060 01020304050 0102030405060 01020304050 0102030405060 01020304050 0102030405060 01020304050 0102030405060 01020304050 0102030405060 01020304050 0102030405060 01020304050 0102030405060 0102030

10 4050 0102030405060 01020304050 010203040
4050 0102030405060 01020304050 0102030405060 01020304050 0102030405060 01020304050 0102030405060 01020304050 0102030405060 01020304050 0102030405060 01020304050 0102030405060 01020304050 0102030405060 01020304050 0102030405060 01020304050 0102030405060Time (seconds) 051015202530Weighted rating meanAwareness of Particles 0102030405060 051015202530 0102030405060 051015202530 0102030405060 051015202530 0102030405060 051015202530 0102030405060 051015202530 0102030405060 051015202530 0102030405060 051015202530 0102030405060 051015202530 0102030405060 051015202530 0102030405060 051015202530 0102030405060 051015202530 0102030405060 051015202530 0102030405060 051015202530 0102030405060 051015202530 0102030405060 051015202530 0102030405060 051015202530 0102030405060 051015202530 0102030405060Time (seconds) 020406080100120Weighted rating meansCohesiveness 0102030405060 020406080100120 0102030405060 020406080100120 0102030405060 020406080100120 0102030405060 020406080100120 0102030405060 020

11 406080100120 0102030405060 0204060801001
406080100120 0102030405060 020406080100120 0102030405060 020406080100120 0102030405060 020406080100120 0102030405060 020406080100120 0102030405060 020406080100120 0102030405060 020406080100120 0102030405060 020406080100120 0102030405060 020406080100120 0102030405060 020406080100120 0102030405060 020406080100120 0102030405060 020406080100120 0102030405060 020406080100120 0102030405060Time (seconds) 050100150Weighted Rating Mean 0102030405060 050100150 0102030405060 050100150 0102030405060 050100150 0102030405060 050100150 0102030405060 050100150 0102030405060 050100150 0102030405060 050100150 0102030405060 050100150 0102030405060 050100150 0102030405060 050100150 0102030405060 050100150 0102030405060 050100150 0102030405060 050100150 0102030405060 050100150 0102030405060 050100150 0102030405060 050100150 0102030405060 050100150 Detailed Findings Panel Descriptive Line-Chew Down & Break Down#C1 --Cherry Chew Candy#C2 --Chocolate Chew Candy#P1 --Prototype 1#P2 --Prototype 2

12 020406080100Time (seconds) 020406080100
020406080100Time (seconds) 020406080100120Weighted Rating Mean 020406080100 020406080100120 020406080100 020406080100120 020406080100 020406080100120 020406080100 020406080100120 020406080100 020406080100120 020406080100 020406080100120 020406080100 020406080100120 020406080100 020406080100120 020406080100 020406080100120 020406080100 020406080100120 020406080100 020406080100120 020406080100 020406080100120 020406080100 020406080100120 020406080100 020406080100120 020406080100 020406080100120 020406080100 020406080100120 020406080100 020406080100120 020406080100Time (seconds) 020406080100120Weighted Rating MeanCohesiveness 020406080100 020406080100120 020406080100 020406080100120 020406080100 020406080100120 020406080100 020406080100120 020406080100 020406080100120 020406080100 020406080100120 020406080100 020406080100120 020406080100 020406080100120 020406080100 020406080100120 020406080100 020406080100120 020406080100 020406080100120 020406080100 020406080100120 020406080100 02

13 0406080100120 020406080100 0204060801001
0406080100120 020406080100 020406080100120 020406080100 020406080100120 020406080100 020406080100120 020406080100 020406080100120 020406080100Time (seconds) 020406080100120Weighted Rating MeanMoistness of Mass 020406080100 020406080100120 020406080100 020406080100120 020406080100 020406080100120 020406080100 020406080100120 020406080100 020406080100120 020406080100 020406080100120 020406080100 020406080100120 020406080100 020406080100120 020406080100 020406080100120 020406080100 020406080100120 020406080100 020406080100120 020406080100 020406080100120 020406080100 020406080100120 020406080100 020406080100120 020406080100 020406080100120 020406080100 020406080100120 020406080100 020406080100120 020406080100 0204060Weighted Rating MeanAwareness of Particles 020406080100Time (seconds) 0204060 020406080100 0204060 020406080100 0204060 020406080100 0204060 020406080100 0204060 020406080100 0204060 020406080100 0204060 020406080100 0204060 020406080100 0204060 020406080100 0204060 02040

14 6080100 0204060 020406080100 0204060 020
6080100 0204060 020406080100 0204060 020406080100 0204060 020406080100 0204060 020406080100 0204060 020406080100 0204060 020406080100 0204060 Detailed Findings Panel Descriptive #P1 --Prototype 1 #C1 --Cherry Chew Candy#P2 --Prototype 2 020406080100 253545 Mean TI Curve (#311,A1)timemean value 020406080100 -2-1012 First Derivative of Mean TI CurvetimeD mean value 020406080100 30507090 Mean TI Curve(#498,A1)timemean value 020406080100 -3.0-1.50.0 First Derivative of Mean TI CurvetimeD mean value 020406080100 2535 Mean TI Curve(#550,A1)timemean value 020406080100 -1.5-0.5 First Derivative of Mean TI CurvetimeD mean value 1. All the derivative curves are below zero except the beginning of #311 (P1)means that the whole trend of intensity is decreasing though the rates of decrease are varying.2. We can see that the time ranges of the changes are different for the samples. #498 (C1)wider time range of changes (0 to 80+) than the other samples.3. We can also that the ra

15 nges of intensity changes are different
nges of intensity changes are different for the samples. #498 (C1)larger range of intensity change (90 to 30) and the range of rate of change (0 to Detailed Findings Panel Descriptive Lines-Residual#C1 --Cherry Chew Candy#C2 --Chocolate Chew Candy#P1 --Prototype 1#P2 --Prototype 2 020406080100Time (seconds) 01020304050Weighted Rating MeanLoose Particles 020406080100 01020304050 020406080100 01020304050 020406080100 01020304050 020406080100 01020304050 020406080100 01020304050 020406080100 01020304050 020406080100 01020304050 020406080100 01020304050 020406080100 01020304050 020406080100 01020304050 020406080100 01020304050 020406080100 01020304050 020406080100 01020304050 020406080100 01020304050 020406080100 01020304050 020406080100 01020304050 020406080100 01020304050 020406080100 0204060Weighted Rating Mean 020406080100Time (seconds) 0204060 020406080100 0204060 020406080100 0204060 020406080100 0204060 020406080100 0204060 020406080100 0204060 020406080100 0204060

16 020406080100 0204060 020406080100 020406
020406080100 0204060 020406080100 0204060 020406080100 0204060 020406080100 0204060 020406080100 0204060 020406080100 0204060 020406080100 0204060 020406080100 0204060 020406080100 0204060 020406080100 0204060 Detailed Findings Descriptive Panel CATA Data 0102030405060708090100110Seconds SurfaceFirst BiteChewdownBreakdownSwallow & Residual11460 secs S tuck to Teeth S urface roperties irst Bite C hew Down B reak Down S wallow esidualFirst BiteDuring ChewSmoothRoughPowderyGrittyWaxyOilyDeformableSpringyUniform BiteDenseToothpullFruitSweetSourBitterOff-NotesSmoothRoughThinThickIrritationAstringentPowderyGrittyWaxyOily Detailed Findings Panel Descriptive CATA-Surface Properties#C1 --Cherry Chew Candy#C2 --Chocolate Chew Candy#P1 --Prototype 1#P2 --Prototype 2 0102030405060Time (seconds) 0.00.20.40.60.81.0Probability 0102030405060 0.00.20.40.60.81.0 0102030405060 0.00.20.40.60.81.0 0102030405060 0.00.20.40.60.81.0 0102030405060 0.00.20.40.60.81.0 0102030405060 0.00.20

17 .40.60.81.0 0102030405060 0.00.20.40.60.
.40.60.81.0 0102030405060 0.00.20.40.60.81.0 0102030405060 0.00.20.40.60.81.0 0102030405060 0.00.20.40.60.81.0 0102030405060 0.00.20.40.60.81.0 0102030405060 0.00.20.40.60.81.0 0102030405060 0.00.20.40.60.81.0 0102030405060 0.00.20.40.60.81.0 0102030405060 0.00.20.40.60.81.0 0102030405060 0.00.20.40.60.81.0 0102030405060 0.00.20.40.60.81.0 0102030405060 0.00.20.40.60.81.0 0102030405060 0.00.20.40.60.81.0 0102030405060Time (seconds) 0.00.20.40.60.81.0ProbabilityRough 0102030405060 0.00.20.40.60.81.0 0102030405060 0.00.20.40.60.81.0 0102030405060 0.00.20.40.60.81.0 0102030405060 0.00.20.40.60.81.0 0102030405060 0.00.20.40.60.81.0 0102030405060 0.00.20.40.60.81.0 0102030405060 0.00.20.40.60.81.0 0102030405060 0.00.20.40.60.81.0 0102030405060 0.00.20.40.60.81.0 0102030405060 0.00.20.40.60.81.0 0102030405060 0.00.20.40.60.81.0 0102030405060 0.00.20.40.60.81.0 0102030405060 0.00.20.40.60.81.0 0102030405060 0.00.20.40.60.81.0 0102030405060 0.00.20.40.60.81.0 0102030405060 0.00.20.40.60.8

18 1.0 0102030405060 0.00.20.40.60.81.0 010
1.0 0102030405060 0.00.20.40.60.81.0 0102030405060Time (seconds) 0.00.20.40.60.81.0ProbabilityWaxy 0102030405060 0.00.20.40.60.81.0 0102030405060 0.00.20.40.60.81.0 0102030405060 0.00.20.40.60.81.0 0102030405060 0.00.20.40.60.81.0 0102030405060 0.00.20.40.60.81.0 0102030405060 0.00.20.40.60.81.0 0102030405060 0.00.20.40.60.81.0 0102030405060 0.00.20.40.60.81.0 0102030405060 0.00.20.40.60.81.0 0102030405060 0.00.20.40.60.81.0 0102030405060 0.00.20.40.60.81.0 0102030405060 0.00.20.40.60.81.0 0102030405060 0.00.20.40.60.81.0 0102030405060 0.00.20.40.60.81.0 0102030405060 0.00.20.40.60.81.0 0102030405060 0.00.20.40.60.81.0 0102030405060 0.00.20.40.60.81.0 0102030405060Time (seconds) 0.00.20.40.60.81.0ProbabilityOily 0102030405060 0.00.20.40.60.81.0 0102030405060 0.00.20.40.60.81.0 0102030405060 0.00.20.40.60.81.0 0102030405060 0.00.20.40.60.81.0 0102030405060 0.00.20.40.60.81.0 0102030405060 0.00.20.40.60.81.0 0102030405060 0.00.20.40.60.81.0 0102030405060 0.00.20.40.60.81.0 010203040

19 5060 0.00.20.40.60.81.0 0102030405060 0.
5060 0.00.20.40.60.81.0 0102030405060 0.00.20.40.60.81.0 0102030405060 0.00.20.40.60.81.0 0102030405060 0.00.20.40.60.81.0 0102030405060 0.00.20.40.60.81.0 0102030405060 0.00.20.40.60.81.0 0102030405060 0.00.20.40.60.81.0 0102030405060 0.00.20.40.60.81.0 0102030405060 0.00.20.40.60.81.0 0102030405060Time (seconds) 0.00.20.40.60.81.0ProbabilityGritty 0102030405060 0.00.20.40.60.81.0 0102030405060 0.00.20.40.60.81.0 0102030405060 0.00.20.40.60.81.0 0102030405060 0.00.20.40.60.81.0 0102030405060 0.00.20.40.60.81.0 0102030405060 0.00.20.40.60.81.0 0102030405060 0.00.20.40.60.81.0 0102030405060 0.00.20.40.60.81.0 0102030405060 0.00.20.40.60.81.0 0102030405060 0.00.20.40.60.81.0 0102030405060 0.00.20.40.60.81.0 0102030405060 0.00.20.40.60.81.0 0102030405060 0.00.20.40.60.81.0 0102030405060 0.00.20.40.60.81.0 0102030405060 0.00.20.40.60.81.0 0102030405060 0.00.20.40.60.81.0 0102030405060 0.00.20.40.60.81.0 Detailed Findings Panel Descriptive CATA-First Bite#C1 --Cherry Chew Can

20 dy#C2 --Chocolate Chew Candy#P1 --Protot
dy#C2 --Chocolate Chew Candy#P1 --Prototype 1#P2 --Prototype 2 0102030405060Time (seconds) 0.00.20.40.60.81.0Probability 0102030405060 0.00.20.40.60.81.0 0102030405060 0.00.20.40.60.81.0 0102030405060 0.00.20.40.60.81.0 0102030405060 0.00.20.40.60.81.0 0102030405060 0.00.20.40.60.81.0 0102030405060 0.00.20.40.60.81.0 0102030405060 0.00.20.40.60.81.0 0102030405060 0.00.20.40.60.81.0 0102030405060 0.00.20.40.60.81.0 0102030405060 0.00.20.40.60.81.0 0102030405060 0.00.20.40.60.81.0 0102030405060 0.00.20.40.60.81.0 0102030405060 0.00.20.40.60.81.0 0102030405060 0.00.20.40.60.81.0 0102030405060 0.00.20.40.60.81.0 0102030405060 0.00.20.40.60.81.0 0102030405060 0.00.20.40.60.81.0 0102030405060Time (seconds) 0.00.20.40.60.81.0ProbabilityUniform Bite 0102030405060 0.00.20.40.60.81.0 0102030405060 0.00.20.40.60.81.0 0102030405060 0.00.20.40.60.81.0 0102030405060 0.00.20.40.60.81.0 0102030405060 0.00.20.40.60.81.0 0102030405060 0.00.20.40.60.81.0 0102030405060 0.00.20.40.60.81.0 010203040506

21 0 0.00.20.40.60.81.0 0102030405060 0.00.
0 0.00.20.40.60.81.0 0102030405060 0.00.20.40.60.81.0 0102030405060 0.00.20.40.60.81.0 0102030405060 0.00.20.40.60.81.0 0102030405060 0.00.20.40.60.81.0 0102030405060 0.00.20.40.60.81.0 0102030405060 0.00.20.40.60.81.0 0102030405060 0.00.20.40.60.81.0 0102030405060 0.00.20.40.60.81.0 0102030405060 0.00.20.40.60.81.0 0102030405060Time (Seconds) 0.00.20.40.60.81.0ProbabilityDense 0102030405060 0.00.20.40.60.81.0 0102030405060 0.00.20.40.60.81.0 0102030405060 0.00.20.40.60.81.0 0102030405060 0.00.20.40.60.81.0 0102030405060 0.00.20.40.60.81.0 0102030405060 0.00.20.40.60.81.0 0102030405060 0.00.20.40.60.81.0 0102030405060 0.00.20.40.60.81.0 0102030405060 0.00.20.40.60.81.0 0102030405060 0.00.20.40.60.81.0 0102030405060 0.00.20.40.60.81.0 0102030405060 0.00.20.40.60.81.0 0102030405060 0.00.20.40.60.81.0 0102030405060 0.00.20.40.60.81.0 0102030405060 0.00.20.40.60.81.0 0102030405060 0.00.20.40.60.81.0 0102030405060 0.00.20.40.60.81.0 0102030405060Time (seconds) 0.00.20.40.60.81.0Probabi

22 lity 0102030405060 0.00.20.40.60.81.0 01
lity 0102030405060 0.00.20.40.60.81.0 0102030405060 0.00.20.40.60.81.0 0102030405060 0.00.20.40.60.81.0 0102030405060 0.00.20.40.60.81.0 0102030405060 0.00.20.40.60.81.0 0102030405060 0.00.20.40.60.81.0 0102030405060 0.00.20.40.60.81.0 0102030405060 0.00.20.40.60.81.0 0102030405060 0.00.20.40.60.81.0 0102030405060 0.00.20.40.60.81.0 0102030405060 0.00.20.40.60.81.0 0102030405060 0.00.20.40.60.81.0 0102030405060 0.00.20.40.60.81.0 0102030405060 0.00.20.40.60.81.0 0102030405060 0.00.20.40.60.81.0 0102030405060 0.00.20.40.60.81.0 0102030405060 0.00.20.40.60.81.0 Detailed Findings Panel Descriptive CATA-Chew Down#C1 --Cherry Chew Candy#C2 --Chocolate Chew Candy#P1 --Prototype 1#P2 --Prototype 2 020406080100Time (seconds) 0.00.20.40.60.81.0Probability 020406080100 0.00.20.40.60.81.0 020406080100 0.00.20.40.60.81.0 020406080100 0.00.20.40.60.81.0 020406080100 0.00.20.40.60.81.0 020406080100 0.00.20.40.60.81.0 020406080100 0.00.20.40.60.81.0 020406080100 0.00.20.40.60.81.0 0204

23 06080100 0.00.20.40.60.81.0 020406080100
06080100 0.00.20.40.60.81.0 020406080100 0.00.20.40.60.81.0 020406080100 0.00.20.40.60.81.0 020406080100 0.00.20.40.60.81.0 020406080100 0.00.20.40.60.81.0 020406080100 0.00.20.40.60.81.0 020406080100 0.00.20.40.60.81.0 020406080100 0.00.20.40.60.81.0 020406080100 0.00.20.40.60.81.0 020406080100 0.00.20.40.60.81.0 020406080100Time (seconds) 0.00.20.40.60.81.0Probability 020406080100 0.00.20.40.60.81.0 020406080100 0.00.20.40.60.81.0 020406080100 0.00.20.40.60.81.0 020406080100 0.00.20.40.60.81.0 020406080100 0.00.20.40.60.81.0 020406080100 0.00.20.40.60.81.0 020406080100 0.00.20.40.60.81.0 020406080100 0.00.20.40.60.81.0 020406080100 0.00.20.40.60.81.0 020406080100 0.00.20.40.60.81.0 020406080100 0.00.20.40.60.81.0 020406080100 0.00.20.40.60.81.0 020406080100 0.00.20.40.60.81.0 020406080100 0.00.20.40.60.81.0 020406080100 0.00.20.40.60.81.0 020406080100 0.00.20.40.60.81.0 020406080100 0.00.20.40.60.81.0 020406080100Time (seconds) 0.00.20.40.60.81.0Probability 020406080100 0.00.20.

24 40.60.81.0 020406080100 0.00.20.40.60.81
40.60.81.0 020406080100 0.00.20.40.60.81.0 020406080100 0.00.20.40.60.81.0 020406080100 0.00.20.40.60.81.0 020406080100 0.00.20.40.60.81.0 020406080100 0.00.20.40.60.81.0 020406080100 0.00.20.40.60.81.0 020406080100 0.00.20.40.60.81.0 020406080100 0.00.20.40.60.81.0 020406080100 0.00.20.40.60.81.0 020406080100 0.00.20.40.60.81.0 020406080100 0.00.20.40.60.81.0 020406080100 0.00.20.40.60.81.0 020406080100 0.00.20.40.60.81.0 020406080100 0.00.20.40.60.81.0 020406080100 0.00.20.40.60.81.0 020406080100 0.00.20.40.60.81.0 Off-Notes— Detailed Findings Panel Descriptive CATA-Break Down#C1 --Cherry Chew Candy#C2 --Chocolate Chew Candy#P1 --Prototype 1#P2 --Prototype 2 020406080100Time (seconds) 0.00.20.40.60.81.0Probability 020406080100 0.00.20.40.60.81.0 020406080100 0.00.20.40.60.81.0 020406080100 0.00.20.40.60.81.0 020406080100 0.00.20.40.60.81.0 020406080100 0.00.20.40.60.81.0 020406080100 0.00.20.40.60.81.0 020406080100 0.00.20.40.60.81.0 020406080100 0.00.20.40.60.81.0 020

25 406080100 0.00.20.40.60.81.0 02040608010
406080100 0.00.20.40.60.81.0 020406080100 0.00.20.40.60.81.0 020406080100 0.00.20.40.60.81.0 020406080100 0.00.20.40.60.81.0 020406080100 0.00.20.40.60.81.0 020406080100 0.00.20.40.60.81.0 020406080100 0.00.20.40.60.81.0 020406080100 0.00.20.40.60.81.0 020406080100 0.00.20.40.60.81.0 020406080100Time (seconds) 0.00.20.40.60.81.0Probability 020406080100 0.00.20.40.60.81.0 020406080100 0.00.20.40.60.81.0 020406080100 0.00.20.40.60.81.0 020406080100 0.00.20.40.60.81.0 020406080100 0.00.20.40.60.81.0 020406080100 0.00.20.40.60.81.0 020406080100 0.00.20.40.60.81.0 020406080100 0.00.20.40.60.81.0 020406080100 0.00.20.40.60.81.0 020406080100 0.00.20.40.60.81.0 020406080100 0.00.20.40.60.81.0 020406080100 0.00.20.40.60.81.0 020406080100 0.00.20.40.60.81.0 020406080100 0.00.20.40.60.81.0 020406080100 0.00.20.40.60.81.0 020406080100 0.00.20.40.60.81.0 020406080100 0.00.20.40.60.81.0 020406080100Time (seconds) 0.00.20.40.60.81.0ProbabilityBitter 020406080100 0.00.20.40.60.81.0 020406080100 0

26 .00.20.40.60.81.0 020406080100 0.00.20.4
.00.20.40.60.81.0 020406080100 0.00.20.40.60.81.0 020406080100 0.00.20.40.60.81.0 020406080100 0.00.20.40.60.81.0 020406080100 0.00.20.40.60.81.0 020406080100 0.00.20.40.60.81.0 020406080100 0.00.20.40.60.81.0 020406080100 0.00.20.40.60.81.0 020406080100 0.00.20.40.60.81.0 020406080100 0.00.20.40.60.81.0 020406080100 0.00.20.40.60.81.0 020406080100 0.00.20.40.60.81.0 020406080100 0.00.20.40.60.81.0 020406080100 0.00.20.40.60.81.0 020406080100 0.00.20.40.60.81.0 020406080100 0.00.20.40.60.81.0 Off-Notes— 020406080100Time (seconds) 0.00.20.40.60.81.0Probability 020406080100 0.00.20.40.60.81.0 020406080100 0.00.20.40.60.81.0 020406080100 0.00.20.40.60.81.0 020406080100 0.00.20.40.60.81.0 020406080100 0.00.20.40.60.81.0 020406080100 0.00.20.40.60.81.0 020406080100 0.00.20.40.60.81.0 020406080100 0.00.20.40.60.81.0 020406080100 0.00.20.40.60.81.0 020406080100 0.00.20.40.60.81.0 020406080100 0.00.20.40.60.81.0 020406080100 0.00.20.40.60.81.0 020406080100 0.00.20.40.60.81.0 020406080100

27 0.00.20.40.60.81.0 020406080100 0.00.20.
0.00.20.40.60.81.0 020406080100 0.00.20.40.60.81.0 020406080100 0.00.20.40.60.81.0 020406080100 0.00.20.40.60.81.0 Detailed Findings Panel Descriptive CATA-Swallow#C1 --Cherry Chew Candy#C2 --Chocolate Chew Candy#P1 --Prototype 1#P2 --Prototype 2 020406080100Time (seconds) 0.00.20.40.60.81.0ProbabilitySmooth 020406080100 0.00.20.40.60.81.0 020406080100 0.00.20.40.60.81.0 020406080100 0.00.20.40.60.81.0 020406080100 0.00.20.40.60.81.0 020406080100 0.00.20.40.60.81.0 020406080100 0.00.20.40.60.81.0 020406080100 0.00.20.40.60.81.0 020406080100 0.00.20.40.60.81.0 020406080100 0.00.20.40.60.81.0 020406080100 0.00.20.40.60.81.0 020406080100 0.00.20.40.60.81.0 020406080100 0.00.20.40.60.81.0 020406080100 0.00.20.40.60.81.0 020406080100 0.00.20.40.60.81.0 020406080100 0.00.20.40.60.81.0 020406080100 0.00.20.40.60.81.0 020406080100 0.00.20.40.60.81.0 020406080100Time (seconds) 0.00.20.40.60.81.0ProbabilityRough 020406080100 0.00.20.40.60.81.0 020406080100 0.00.20.40.60.81.0 02040

28 6080100 0.00.20.40.60.81.0 020406080100
6080100 0.00.20.40.60.81.0 020406080100 0.00.20.40.60.81.0 020406080100 0.00.20.40.60.81.0 020406080100 0.00.20.40.60.81.0 020406080100 0.00.20.40.60.81.0 020406080100 0.00.20.40.60.81.0 020406080100 0.00.20.40.60.81.0 020406080100 0.00.20.40.60.81.0 020406080100 0.00.20.40.60.81.0 020406080100 0.00.20.40.60.81.0 020406080100 0.00.20.40.60.81.0 020406080100 0.00.20.40.60.81.0 020406080100 0.00.20.40.60.81.0 020406080100 0.00.20.40.60.81.0 020406080100 0.00.20.40.60.81.0 020406080100Time (seconds) 0.00.20.40.60.81.0Probability 020406080100 0.00.20.40.60.81.0 020406080100 0.00.20.40.60.81.0 020406080100 0.00.20.40.60.81.0 020406080100 0.00.20.40.60.81.0 020406080100 0.00.20.40.60.81.0 020406080100 0.00.20.40.60.81.0 020406080100 0.00.20.40.60.81.0 020406080100 0.00.20.40.60.81.0 020406080100 0.00.20.40.60.81.0 020406080100 0.00.20.40.60.81.0 020406080100 0.00.20.40.60.81.0 020406080100 0.00.20.40.60.81.0 020406080100 0.00.20.40.60.81.0 020406080100 0.00.20.40.60.81.0 020406080100 0.

29 00.20.40.60.81.0 020406080100 0.00.20.40
00.20.40.60.81.0 020406080100 0.00.20.40.60.81.0 020406080100 0.00.20.40.60.81.0 020406080100 0.00.20.40.60.81.0Probability 020406080100 0.00.20.40.60.81.0 020406080100 0.00.20.40.60.81.0 020406080100 0.00.20.40.60.81.0 020406080100 0.00.20.40.60.81.0 020406080100 0.00.20.40.60.81.0 020406080100 0.00.20.40.60.81.0 020406080100 0.00.20.40.60.81.0 020406080100 0.00.20.40.60.81.0 020406080100 0.00.20.40.60.81.0 020406080100 0.00.20.40.60.81.0 020406080100 0.00.20.40.60.81.0 020406080100 0.00.20.40.60.81.0 020406080100 0.00.20.40.60.81.0 020406080100 0.00.20.40.60.81.0 020406080100 0.00.20.40.60.81.0 020406080100 0.00.20.40.60.81.0 020406080100 0.00.20.40.60.81.0Time (seconds) 020406080100Time (seconds) 0.00.20.40.60.81.0ProbabilityIrritation 020406080100 0.00.20.40.60.81.0 020406080100 0.00.20.40.60.81.0 020406080100 0.00.20.40.60.81.0 020406080100 0.00.20.40.60.81.0 020406080100 0.00.20.40.60.81.0 020406080100 0.00.20.40.60.81.0 020406080100 0.00.20.40.60.81.0 020406080100 0.00.20.4

30 0.60.81.0 020406080100 0.00.20.40.60.81.
0.60.81.0 020406080100 0.00.20.40.60.81.0 020406080100 0.00.20.40.60.81.0 020406080100 0.00.20.40.60.81.0 020406080100 0.00.20.40.60.81.0 020406080100 0.00.20.40.60.81.0 020406080100 0.00.20.40.60.81.0 020406080100 0.00.20.40.60.81.0 020406080100 0.00.20.40.60.81.0 020406080100 0.00.20.40.60.81.0 Detailed Findings Panel Descriptive CATA-Residual#C1 --Cherry Chew Candy#C2 --Chocolate Chew Candy#P1 --Prototype 1#P2 --Prototype 2 020406080100Time (seconds) 0.00.20.40.60.81.0ProbabilityAstringent 020406080100 0.00.20.40.60.81.0 020406080100 0.00.20.40.60.81.0 020406080100 0.00.20.40.60.81.0 020406080100 0.00.20.40.60.81.0 020406080100 0.00.20.40.60.81.0 020406080100 0.00.20.40.60.81.0 020406080100 0.00.20.40.60.81.0 020406080100 0.00.20.40.60.81.0 020406080100 0.00.20.40.60.81.0 020406080100 0.00.20.40.60.81.0 020406080100 0.00.20.40.60.81.0 020406080100 0.00.20.40.60.81.0 020406080100 0.00.20.40.60.81.0 020406080100 0.00.20.40.60.81.0 020406080100 0.00.20.40.60.81.0 0204060

31 80100 0.00.20.40.60.81.0 020406080100 0.
80100 0.00.20.40.60.81.0 020406080100 0.00.20.40.60.81.0 020406080100Time (seconds) 0.00.20.40.60.81.0Probability 020406080100 0.00.20.40.60.81.0 020406080100 0.00.20.40.60.81.0 020406080100 0.00.20.40.60.81.0 020406080100 0.00.20.40.60.81.0 020406080100 0.00.20.40.60.81.0 020406080100 0.00.20.40.60.81.0 020406080100 0.00.20.40.60.81.0 020406080100 0.00.20.40.60.81.0 020406080100 0.00.20.40.60.81.0 020406080100 0.00.20.40.60.81.0 020406080100 0.00.20.40.60.81.0 020406080100 0.00.20.40.60.81.0 020406080100 0.00.20.40.60.81.0 020406080100 0.00.20.40.60.81.0 020406080100 0.00.20.40.60.81.0 020406080100 0.00.20.40.60.81.0 020406080100 0.00.20.40.60.81.0 020406080100Time (seconds) 0.00.20.40.60.81.0ProbabilityGritty 020406080100 0.00.20.40.60.81.0 020406080100 0.00.20.40.60.81.0 020406080100 0.00.20.40.60.81.0 020406080100 0.00.20.40.60.81.0 020406080100 0.00.20.40.60.81.0 020406080100 0.00.20.40.60.81.0 020406080100 0.00.20.40.60.81.0 020406080100 0.00.20.40.60.81.0 020406080100 0.00.

32 20.40.60.81.0 020406080100 0.00.20.40.60
20.40.60.81.0 020406080100 0.00.20.40.60.81.0 020406080100 0.00.20.40.60.81.0 020406080100 0.00.20.40.60.81.0 020406080100 0.00.20.40.60.81.0 020406080100 0.00.20.40.60.81.0 020406080100 0.00.20.40.60.81.0 020406080100 0.00.20.40.60.81.0 020406080100 0.00.20.40.60.81.0 020406080100Time (seconds) 0.00.20.40.60.81.0ProbabilityWaxy 020406080100 0.00.20.40.60.81.0 020406080100 0.00.20.40.60.81.0 020406080100 0.00.20.40.60.81.0 020406080100 0.00.20.40.60.81.0 020406080100 0.00.20.40.60.81.0 020406080100 0.00.20.40.60.81.0 020406080100 0.00.20.40.60.81.0 020406080100 0.00.20.40.60.81.0 020406080100 0.00.20.40.60.81.0 020406080100 0.00.20.40.60.81.0 020406080100 0.00.20.40.60.81.0 020406080100 0.00.20.40.60.81.0 020406080100 0.00.20.40.60.81.0 020406080100 0.00.20.40.60.81.0 020406080100 0.00.20.40.60.81.0 020406080100 0.00.20.40.60.81.0 020406080100 0.00.20.40.60.81.0 020406080100Time (seconds) 0.00.20.40.60.81.0ProbabilityOily 020406080100 0.00.20.40.60.81.0 020406080100 0.00.20.40.60.

33 81.0 020406080100 0.00.20.40.60.81.0 020
81.0 020406080100 0.00.20.40.60.81.0 020406080100 0.00.20.40.60.81.0 020406080100 0.00.20.40.60.81.0 020406080100 0.00.20.40.60.81.0 020406080100 0.00.20.40.60.81.0 020406080100 0.00.20.40.60.81.0 020406080100 0.00.20.40.60.81.0 020406080100 0.00.20.40.60.81.0 020406080100 0.00.20.40.60.81.0 020406080100 0.00.20.40.60.81.0 020406080100 0.00.20.40.60.81.0 020406080100 0.00.20.40.60.81.0 020406080100 0.00.20.40.60.81.0 020406080100 0.00.20.40.60.81.0 020406080100 0.00.20.40.60.81.0 Detailed Findings Panel Descriptive Lines and CATA -C1 vs. P2 020406080100Time (seconds) 020406080100120Weighted rating mean 020406080100 020406080100120 020406080100 020406080100120 020406080100 020406080100120 020406080100 020406080100120 020406080100 020406080100120 020406080100 020406080100120 020406080100 020406080100120 020406080100 020406080100120 020406080100 020406080100120 020406080100 020406080100120 020406080100 020406080100120 020406080100 020406080100120 020406080100 02040608010012

34 0 020406080100 020406080100120 020406080
0 020406080100 020406080100120 020406080100 020406080100120 020406080100 020406080100120 020406080100 020406080100120CohesivenessMoistness of MouthfeelLoose Particles Moistness of MassAwareness of Particles 020406080100Time (seconds) 020406080100120Weighted rating mean#P2 -- Prototype 2 020406080100 020406080100120 020406080100 020406080100120 020406080100 020406080100120 020406080100 020406080100120 020406080100 020406080100120 020406080100 020406080100120 020406080100 020406080100120 020406080100 020406080100120 020406080100 020406080100120 020406080100 020406080100120 020406080100 020406080100120 020406080100 020406080100120 020406080100 020406080100120 020406080100 020406080100120 020406080100 020406080100120 020406080100 020406080100120 020406080100 020406080100120 Moistness of Mouthfeel Loose ParticlesHardnessMoistness of MassAwareness of Particles 020406080100Time (seconds) 0.00.20.40.60.81.0Probability#P2 -- Prototype 2 020406080100 0.00.20.40.60.81.0 020406080100 0.00.20.

35 40.60.81.0 020406080100 0.00.20.40.60.81
40.60.81.0 020406080100 0.00.20.40.60.81.0 020406080100 0.00.20.40.60.81.0 020406080100 0.00.20.40.60.81.0 020406080100 0.00.20.40.60.81.0 020406080100 0.00.20.40.60.81.0 020406080100 0.00.20.40.60.81.0 020406080100 0.00.20.40.60.81.0 020406080100 0.00.20.40.60.81.0 020406080100 0.00.20.40.60.81.0 020406080100 0.00.20.40.60.81.0 020406080100 0.00.20.40.60.81.0 020406080100 0.00.20.40.60.81.0 020406080100 0.00.20.40.60.81.0 020406080100 0.00.20.40.60.81.0 020406080100 0.00.20.40.60.81.0 Fruit Sour SweetAstringent 020406080100Time (seconds) 0.00.20.40.60.81.0Probability#C1 -- Cherry Chew Candy 020406080100 0.00.20.40.60.81.0 020406080100 0.00.20.40.60.81.0 020406080100 0.00.20.40.60.81.0 020406080100 0.00.20.40.60.81.0 020406080100 0.00.20.40.60.81.0 020406080100 0.00.20.40.60.81.0 020406080100 0.00.20.40.60.81.0 020406080100 0.00.20.40.60.81.0 020406080100 0.00.20.40.60.81.0 020406080100 0.00.20.40.60.81.0 020406080100 0.00.20.40.60.81.0 020406080100 0.00.20.40.60.81.0 020406080100

36 0.00.20.40.60.81.0 020406080100 0.00.20
0.00.20.40.60.81.0 020406080100 0.00.20.40.60.81.0 020406080100 0.00.20.40.60.81.0 020406080100 0.00.20.40.60.81.0 020406080100 0.00.20.40.60.81.0FruitSweet Astringent 020406080100Time (seconds) 020406080100120Weighted Rating Mean 020406080100 020406080100120 020406080100 020406080100120 020406080100 020406080100120 020406080100 020406080100120 020406080100 020406080100120 020406080100 020406080100120 020406080100 020406080100120 020406080100 020406080100120 020406080100 020406080100120 020406080100 020406080100120 020406080100 020406080100120 020406080100 020406080100120 020406080100 020406080100120 020406080100 020406080100120 020406080100 020406080100120 020406080100 020406080100120 020406080100 020406080100120 Detailed Findings Panel Descriptive FPCA and K-means Cluster Analysis#C1 --Cherry Chew Candy#C2 --Chocolate Chew Candy#P1 --Prototype 1#P2 --Prototype 2 -150-100-50050 FPC 1 – 95.8% Variance Explained125194319491582608672773892924938 Functional PCA (FPCA)An ei

37 genfunctionassociated with each eigenval
genfunctionassociated with each eigenvalueFPCA provides PC scores for each curveConverted to 2-3 dimensionsCurves presented as pointsCluster analysis on FPC scores Detailed Findings Panel Descriptive Functional Curves and FPC Space -200-1000100200300FPC1 -150-100-50050100FPC2Positions of Curves 200-100 0100200300PC1-150-100-50 050100PC205e-60.000011.5e.000022.5e-5Density funct Original curves (top right)Positions of curves in the first 2 Density of points in the FPC space using S-Plus ‘sm’ (bottom right) #C1 --Cherry Chew Candy#P1 --Prototype 1#P2 --Prototype 2 020406080100Time (seconds) 050100150Weighted Rating MeanCurves of 3 samples for Hardness 020406080100 050100150 020406080100 050100150 020406080100 050100150 020406080100 050100150 020406080100 050100150 020406080100 050100150 020406080100 050100150 020406080100 050100150 020406080100 050100150 020406080100 050100150 020406080100 050100150 020406080100 050100150 020406080100 050100150 020406080100 050100150 02040

38 6080100 050100150 020406080100 050100150
6080100 050100150 020406080100 050100150 020406080100 050100150 020406080100 050100150 020406080100 050100150 020406080100 050100150 020406080100 050100150 020406080100 050100150 020406080100 050100150 020406080100 020406080100 050100150 020406080100 050100150 Detailed Findings Panel Descriptive FANOVA-Test for Predicted Curves#C1 --Cherry Chew Candy#P1 --Prototype 1#P2 --Prototype 2 020406080100 80 Predicted Curves of ProductsTime (seconds) C1 P2 020406080100 0.40.81.2 Permutation F-TestTime (seconds)F- statistic Observed Statisticpointwise 0.05 critical valuemaximum 0.05 critical valueCOHESIVENESSAnalysis of Variance (FANOVA) is used to compare the mean curvesdifferences are shown here for ‘Cohesiveness’ Detailed Findings Panel Descriptive CATA Maximum Selection Probabilities#C1 --Cherry Chew Candy#P1 --Prototype 1#P2 --Prototype 2Categories of CATA Attributes in Different Stages and Their Predicted Maximum Stage12345FruitSweetSourBitterOff-Notes(0.22 at 11 s

39 ec.)(0.28 at 12 sec.)(0.21 at 41 sec.)(0
ec.)(0.28 at 12 sec.)(0.21 at 41 sec.)(0 at all time)(0 at all time)FruitSweetSourBitterOff-Notes(0.32 at 44 sec.)(0.34 at 21 sec.)(0.65 at 32 sec.)(0 at all time)(0 at all time)AstringentPowderyGrittyWaxyOily(0.89 at 100 sec.)(0.11 at 100 sec.)(1.00 at 77 sec.)(0.45 at 73 sec.)(0.67 at 91 sec.)SmoothRoughThinThickIrritation(0.23 at 64 sec.)(0.78 at 100 sec.)(0.78 at 92 sec.)(0.23 at 62 sec.)(0.34 at 100 sec.)ResidualSwallowChewQownBreakDown Stage12345FruitSweetSourp-v=0.311p-v=0.368p-v=0.472FruitSweetSourp-v=0.174p-v=0.015*p-v=0.174AstringentPowderyGrittyWaxyOilyp-v=0.223p-v=0.368p-v=0.00*p-v=0.565p-v=0.223SmoothRoughThinThickIrritationp-v=0.001*p-v=0.001*p-v=1.00p-v=0.223p-v=0.779ResidualSwallowChewQownBitterOff-NotesBreakDownBitterOff-Notes P-values of Cochran’s Q tests for the CATA Attributes Among the Observed Values for Three Samples**Significant at alpha=0.05.Cochran’s Q test applied to the CATA attributes involves comparison of correlated proportions. Detailed Findings

40 Panel Performance Panel and P
Panel Performance Panel and PanelistsICC can measure both panelists and sensitivityof panel or panelists--hence ICC can handle the problems of both validityis defined as a ratio of variance of effects to total variance in a random effects model or a variance components model is multivariate generalization of the univariateICC. The usefulness of the MICC is that the interrelationships among the different attributes of interest can be assessed.Cronbach’scoefficient alpha is, in fact, a version of ICC.They are one-to-one correspondence. Detailed Findings Panel Descriptive ICC and Cronbach’sCoefficient Alpha#C1 --Cherry Chew Candy#P1 --Prototype 1#P2 --Prototype 2ICC and Cronbach’scoefficient alpha can be used to measure performance of traditional profiling sensory data. Out of 28, 24 attributes are satisfied. Nunnally’s Rule of Thumb: Cronbach’s coefficient al�pha 0.7, the reliability will suffice. 0.00.20.40.60.81.0 Reliability of Performance (ICC) 0.00.20.

41 40.60.81.0 RoughnessHardnessFirst Bite A
40.60.81.0 RoughnessHardnessFirst Bite AdhesivenessCohesivenessFracturabilityDissolvabilityChew Down AdhesivenessCohesiveness of MassMoistness of MassRoughness of MassParticle SizeAmount of GritToothpack/Toothstick Loose ParticlesChalky MouthcoatOily MouthcoatOverall Aroma IntensityOverall.Flavor.IntensityIdentified Flavor IntensityOverall Dairy ImpressionSweet AromaticBalance/BlendSweetSourSaltBitterOverall Off-Notes Intensity15-Sec.AftertasteReliability of Performance (Cronbach's Alpha) Detailed Findings Panel Descriptive ICC and Cronbach’sCoefficient AlphaICC and Cronbach’scoefficient alpha can be used to measure performance of MATI sensory descriptive data.Reliability for 4 of the 6 attributes suffice.Nunnally’s Rule of Thumb: Cronbach’s coefficient al�pha 0.7, the reliability will suffice. 0.00.20.40.60.8 Reliability of Performance (ICC) 0.00.20.40.60.81.0 HardnessCohesivenessMoistness of MassAwareness of ParticlesMoistness MouthfeelLoose ParticlesReliability of P

42 erformance (Cronbach's Alpha)Cronbach's
erformance (Cronbach's Alpha)Cronbach's Alpha 0.00.20.40.6 Reliability of Performance (ICC)ICC Moistness of Mass 0.00.20.40.60.8 HardnessCohesivenessAwareness of ParticlesMoistness MouthfeelLoose ParticlesReliability of Performance (Cronbach's Alpha)Cronbach's Alpha #C1 --Cherry Chew Candy#P1 --Prototype 1#P2 --Prototype 2 Detailed Findings Panel Descriptive ICC and Cronbach’sCoefficient AlphaSample effect p-values for different approaches may be compared. Also, it is possible to compare ICC and Cronbach’scoefficient alpha values for Imax data, FPC1 scores and the traditional panel data.#C1 --Cherry Chew Candy#P1 --Prototype 1#P2 --Prototype 2ANOVA for Imax in curvesMANOVA for 2 FPC scoresHANOVAfor discrete time pointsFNOVA for curves based on permutationANOVA for traditional panel dataHardness0.0010.0010.0010.0010.001Cohesiveness0.0010.0040.0010.0010.001Moistness of Mass0.270.1070.3220.0070.001Awareness of Particles0.0010.004--*0.0050.001Moistness Mouthfeel0.0130.0820.680.845

43 Loose Particles0.0010.0040.0010.1 P-valu
Loose Particles0.0010.0040.0010.1 P-values for test sample effect based on different approaches and dataNote:*HANOVA failed to test groups of curves with one group of zero curves. ICC and Cronbach’s coefficient alphaNote: ICC= 0.21 and 0.18 correspond to Cronbach’s coefficient alpha=0.7 for n= 9 and 11, (panelists) respectively.ICCCronbach’ICCCronbach’ICCCronbach’Hardness0.920.990.660.960.950.99Cohesiveness0.490.90.520.910.90.99Moistness of Mass-0.0400.010.070.610.95Awareness of Particles0.490.90.490.90.930.99Moistness Mouthfeel0.070.42-0.050Loose Particles0.510.90.370.840.840.98Traditional panel dataImax dataFPC1 scores Detailed Findings Panel Relative Importance of JAR AttributesConsumers want a smoother, brighter colored, sweeter, more chewy product.#C1 --Cherry Chew Candy#P1 --Prototype 1#P2 --Prototype 2 010203040Color Fruit Sweet Sour Chewy Rate Particles Smooth Overall Flavor Dissolves FlavorRelative Imp

44 ortances for Overall Liking% of RThe re
ortances for Overall Liking% of RThe relative importance analysis is based on the pooled data of all the 3 samples. Smooth, Color, Sweet and Particles are relatively of more importance to overall liking based on the data. Detailed Findings Panel Proportional Odds Model (POM)The proportional odds model (POM) applied to both ordinal measures of ‘Pleasantness of Aftertaste’ and ‘Expectations’ for the chews show the predicted probabilities of response for both prototypes vs. C1. #P1 --Prototype 1#C1 --Cherry Chew Candy#P2 --Prototype 2 0.00.20.40.60.8 Not at allSlightlyModeratelyVeryExtremelyPredicted Prob. 0.00.20.40.60.8 Not at allSlightlyModeratelyVeryExtremelyPredicted Prob. 0.00.20.40.60.8 Not at allSlightlyModeratelyVeryExtremelyPredicted Prob. Pleasantness of Taste Left in Mouth after SwallowingPredicted ProbabilityExpectations for a Chew 0.00.20.40.60.8 Much WorseSlightly WorseAbout WhatI ExpectedMuch Predicted Prob. 0.00.20.40.60.8 MuchWorseWorseAbout WhatI ExpectedMuchBe

45 tterPredicted Prob. 0.00.20.40.60.8 Much
tterPredicted Prob. 0.00.20.40.60.8 MuchWorseWorseAbout WhatI ExpectedMuchBetterPredicted Prob. Texture Breakdown PathConclusions regarding MATI are as follows:MATI is a natural extension of traditional TI with one attributeRapid ‘real-time’ assessment tool for product screening and Can be applied successfully for gathering information Texture Breakdown Path Consumption events can be logged Allows for relating sensory and consumer data on a time-dependent basisOffers new statistical analyses of TI data AcknowledgementsAmway Gene Maly, Sr. Principal Research Scientist (Formulation)Troy Nietling, Technician (Product Development)Jenny Wu, Research Scientist (Sensory)Laura Malnor, Associate Research Scientist (Sensory)Descriptive and consumer panelistsSensometrics Research and Services Bi, J. (2006). Sensory Discrimination Tests and Measurements: Statistical Principles, Procedures and Tables. Ames: Wiley/Blackwell Publishing.Bi, J. and Kuesten, C. (2012 )Intraclasscorrelation coef

46 ficient (ICC): A framework for monitori
ficient (ICC): A framework for monitoring and assessing performance of trained sensory panels and panelists. Journal of Sensory Studies 27, 352–364.Bi, J. and Kuesten, C. (2013). Using functional data analysis (FDA) methodology and the R package ‘fda’ for sensory time-intensity evaluation. Journal of Sensory Studies 28, 474-482. Bowman, A.W. and Azzalini, A. (1997). Applied Smoothing Techniques for Data Analysis. Clarendon Press, Oxford.Dijksterhuis, G.B. (1993). Principal components analysis of time intensity bitterness curves. Journal of Sensory Studies 8, FAN, J. and LIN, S-K. 1998. Test of significance when data are curves. Journal of the American Statistical Association 93, Hutchings, J.B. and P. J. Lillford. 1988. The perception of food texture-The philosophy of the breakdown path. Journal of Texture Studies 19, 103-1 15.Kuesten, C., Bi, J. and Feng Y-H. (2013). Exploring taffy product consumption experiences using a multi-attribute time-intensity (MATI) meth

47 od. Food Quality and Preference 30, 260
od. Food Quality and Preference 30, 260-273.Nunnally, J.C. 1978. Psychometric Theory. 2nd Ed. McGraw-Hill: New York.Peyvieux, C. and Dijksterhuis, G. (2001). Training a sensory panel for TI: a case study. Food Quality and Preference 12, 19-Pinto, F.S.T., Fogliatto, F.S., and Qannari, E.M. 2014. A method for panelists’ consistency assessment in sensory evaluation based on the Cronbach’salpha coefficient. Food Quality and Preference 32, 41-47.Ramsay J.O. and Silverman, B.W. (2005). Functional Data Analysis (2nd ed.), New York:Springer.Ramsay, J.O., Hooker, G. and Graves, S. (2013). R Package ‘fda’ (version 2.3.8) http://cran.cnr.berkeley.edu (accessed September 12, 2013). Tomic, O., Forde, C., Delahunty, C., and NaesT. 2013. Performance indices in descriptive sensory analysis—A complimentary screening tool for assessor and panel performance. Food Quality and Preference, 28, 122-133.Van Buuren, S. (1992). Analyzing time intensity responses in sensory evaluation.