PPT-1/2/3 dimensional visualization of RNA
Author : olivia-moreira | Published Date : 2016-05-12
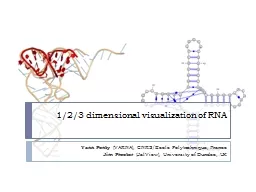
Yann Ponty VARNA CNRS Ecole Polytechnique France Jim Procter JalView University of Dundee UK Goals To help your survive the RNA data jungle To conceptually
Presentation Embed Code
Download Presentation
Download Presentation The PPT/PDF document "1/2/3 dimensional visualization of RNA" is the property of its rightful owner. Permission is granted to download and print the materials on this website for personal, non-commercial use only, and to display it on your personal computer provided you do not modify the materials and that you retain all copyright notices contained in the materials. By downloading content from our website, you accept the terms of this agreement.
1/2/3 dimensional visualization of RNA: Transcript
Download Rules Of Document
"1/2/3 dimensional visualization of RNA"The content belongs to its owner. You may download and print it for personal use, without modification, and keep all copyright notices. By downloading, you agree to these terms.
Related Documents