PDF-Cross Tabulation Analysis
1
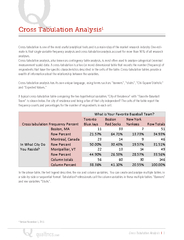
Cross Tabulation Analysis
1
Crosstabulation is one of the most useful analytical tools and is a mainstay of the market research industry One esti mate is that
Download Presentation
"Cross Tabulation Analysis" is the property of its rightful owner. Permission is granted to download and print materials on this website for personal, non-commercial use only, provided you retain all copyright notices. By downloading content from our website, you accept the terms of this agreement.
Presentation Transcript
Transcript not available.