/
Current Demographic Changes in Texas Relevant to Health Wor Current Demographic Changes in Texas Relevant to Health Wor

Current Demographic Changes in Texas Relevant to Health Wor - PowerPoint Presentation

olivia-moreira
olivia-moreira . @olivia-moreira
Follow
377 views
Uploaded On 2016-03-18

Current Demographic Changes in Texas Relevant to Health Wor - PPT Presentation

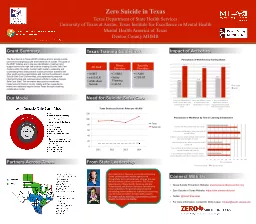
State Health Plan Population Working Group Presented by Karl Eschbach PhD Current population trends with implications for health care demand Rapid growth rate Geographic shifts Shifts in ethnic composition ID: 260274

texas 2000 2008 source 2000 texas source 2008 census population state growth data center age 2007 000 estimates projected

Share:

Link:

Embed:

Download Presentation from below link

Download Presentation The PPT/PDF document "Current Demographic Changes in Texas Rel..." is the property of its rightful owner. Permission is granted to download and print the materials on this web site for personal, non-commercial use only, and to display it on your personal computer provided you do not modify the materials and that you retain all copyright notices contained in the materials. By downloading content from our website, you accept the terms of this agreement.


Presentation Transcript

Slide1

Current Demographic Changes in Texas Relevant to Health Workforce Demand

State Health Plan

Population Working Group

Presented by

Karl

Eschbach

, Ph.D.Slide2

Current population trends with implications for health care demand

Rapid growth rate

Geographic shifts

Shifts in ethnic compositionAging of the populationIncreases in morbidity

2Slide3

Fastest Growing States, 2000-2009

State

2000

Population

2009

Population

NumericalChange2000-2009PercentChange2000-2009Rank in Percent ChangeTexas20,851,82024,782,3023,930,48218.86California33,871,64836,961,6643,090,0169.119Florida15,982,37818,537,9692,555,59116.09Georgia8,186,4539,829,2111,642,75820.14Arizona5,130,6326,595,7781,465,14628.62North Carolina8,049,3139,380,8841,331,57116.58Virginia7,078,5157,882,590804,07511.415Washington5,894,1216,664,195770,07413.111Colorado4,301,2615,024,748723,48716.87Nevada1,998,2572,643,085644,82832.31

Source: 2000 Census and 2009 Vintage Census Bureau EstimatesSlide4

Sources of population growth 2008 to 2009+ Births: +410,000

-Deaths: -164,000

+Migration from other countries: +88,000

+Migration from other states: +143,000Total: ~477,000

Source: U.S. Bureau of the Census, 2009 Vintage EstimatesSlide5

Natural Increase in Texas(Births minus Deaths)

Birth Rate:

16.8 per 1,000 vs.

14.0 for US (2

nd

highest)Death Rate: 6.8 per 1,000 vs. 8.3 for US (5th lowest)Natural Increase: 10.0 per 1,000 vs. 5.7 for US (3rd high)Texas is young: Median Age: 33.2 vs. 36.8 for US (2nd lowest)Texas has a high total fertility rate (Children per woman) 2.34 vs. 2.05 for US (4th highest)Source: NCHS Vital Statistics Data, 2005 http://wonder.cdc.gov/ Slide6

Natural Increase per 1,000 by state

Source: NCHS Vital Statistics Data, 2005

http://wonder.cdc.gov/

Slide7

Total Fertility Rate by Ethnicity, Texas, 2000

Sources: Calculated from Census 2000 5% Public-Use

Microdata

File and

National Center for Health Statistics

Natality

Detail File, 2000,Slide8

Annual Net Migration to Texas, 2000 to 2008

8

Source: U.S. Bureau of the Census 2008 EstimatesSlide9

Projected Population of Texas to 2040 (Millions)

Source: Texas State Data Center Population Projections

4Slide10

Population Change by Area, 2000-2008

County

Population

Percent

Increase

Births-Deaths

Migration20002008ChangeForeignDomesticBig 5 Cities 5,524,3156,334,169809,85415nananaBig 5 Counties9,270,90710,768,7091,497,80216981,509580,088-129,327Suburban to Big Five3,567,5104,943,4871,375,97739328,96693,530953,905Border Metros1,777,4292,098,343320,91418288,30293,173-51,103All Other Metros3,328,7023,533,922205,220 6196,14338,559-16,024All Non-Metro2,907,2722,982,51375,241 390,02746,559-45,666Total20,851,82024,326,9743,475,154171,884,947851,909711,785Big 5 Cities: Houston, San Antonio, Dallas, Austin, Fort WorthBig 5 Counties: Harris, Dallas, Bexar, Tarrant, TravisSource: U.S. Bureau of the Census, 2000 Counts, 2008 Vintage EstimatesSlide11
Slide12

Growth of Texas Race/Ethnic Groups 2000-2008

Race/

Ethnic

Group

2000

2008

GrowthPercent IncreasePercent of GrowthBlack2,349,6412,748,323398,68217.011.5Anglo10,927,53811,525,623598,0855.517.2Latino 6,670,1228,870,4752,200,35333.063.3Asian549,054810,967261,91347.77.5Other/Two +355,465371,58616,1214.50.5Total20,853,82024,328,9823,475,15416.7100.0Sources: 2000 Census, Census 2008 Vintage Estimates10Slide13

Projected Population (Millions) by Race/Ethnicity 2000-2010

Long-term

Growth Migration Scenario

Year

Total

Anglo

BlackLatinoAsian and other200020.911.12.4 6.70.7201024.311.52.8 9.11.0202028.011.83.111.91.3203031.811.83.315.11.6204035.811.53.418.82.0Short-term Growth Migration ScenarioYearTotalAngloBlackLatinoAsian and Other200020.911.12.4 6.70.7201025.411.42.9 9.81.2202030.911.63.413.91.9203037.311.53.919.02.9204044.911.24.325.14.2Source: Texas State Data Center ProjectionsLong-term: ½ of 1990 to 2000; Short-term: Estimated 2000 to 2007Slide14

When do Hispanics pass Anglos in Texas?When do Hispanics become a majority in Texas?

Migration

Scenario

Pass

Anglos

?

AbsoluteMajority?No Migration2034 2040+1/2 of 1990-20002020 2035Observed 1990-20002014 2026Estimated 2000-20072015 2028Source: Texas State Data Center ProjectionsSlide15

15Slide16

Population Growth by Age,2000 to 2008

Sources: 2000 Census, Census 2008 Vintage Estimates

8Slide17

Table 2. Projected Annual Growth Rate:

Total and Ages 65 and older in Texas, 2000-2040

17Slide18

Observed and projected growth by age, 2000 to 2008, and 2008 to 2016

Sources: U.S. Census 2000, 2008 Vintage Estimates, State Data Center Projections Slide19

19Slide20

20Slide21

Projected percent 65-years-old or older, 2000-2040 by areaSlide22

Obese or Overweight 1995-2007

Source: Centers for Disease Control, BRFSSSlide23

Age and Obesity in Texas 1995, 2000, 2007

Source: Centers for Disease Control, BRFSSSlide24

Race/Ethnicity and Obesity in Texas, 1995 and 2007

Source: Centers for Disease Control, BRFSSSlide25

Projected Increase in Obesity in Texas by Ethnicity, 2006 to 2040

Source: Texas State Data Center ProjectionsSlide26

Insurance coverage and no insurance by type for ethnic groups, 2008

26Slide27

Source: State Data Center tabulation of U.S. Bureau of the Census, American Community Survey, 2007

Percent of Texans Reporting a Self-Care

Limitation or Any Limitation, by Age, 2007Slide28

Source:

State Data Center tabulation of U.S. Bureau of the Census, American Community Survey, 2007

Percent Age of Texans Age 65 or Older Reporting

An Activity Limitation, 2007, by EthnicitySlide29

Projected Growth of the 65+ Population Reporting a

Self-Care Limitation, 2000 to 2040, Assuming

Constant Age/Sex/Race/Ethnic Rates of Disability

Source:

Office of the State Demographer, 2000-2004 Projection ScenarioSlide30

Contact InformationKarl

Eschbach

, Ph.D.

Professor and Director of Population ResearchDepartment of Internal Medicine-Geriatrics 0460University of Texas Medical Branch

301 University Blvd

Galveston, TX 77555-0460

(409) 747-3516 Phone(409) 772-8931 Faxkaeschba@utmb.edu30