/
Ground Based Measurements of Aerosols and Precipitation Ground Based Measurements of Aerosols and Precipitation

Ground Based Measurements of Aerosols and Precipitation - PowerPoint Presentation

olivia-moreira
olivia-moreira . @olivia-moreira
Follow
403 views
Uploaded On 2017-12-02

Ground Based Measurements of Aerosols and Precipitation - PPT Presentation

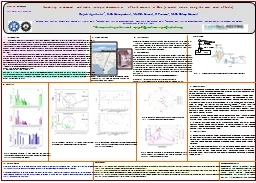
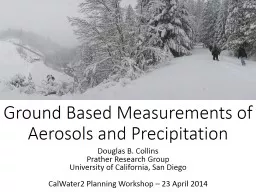
Douglas B Collins Prather Research Group University of California San Diego CalWater2 Planning Workshop 23 April 2014 UCSDSIO Mobile Laboratory FieldDeployable Platform 20 x 7 Double Axle Box Trailer ID: 611793

bodega aerosol particle marine aerosol bodega marine particle bay dam sugar bby elevation spd jet features pine barrier sources

Share:

Link:

Embed:

Download Presentation from below link

Download Presentation The PPT/PDF document "Ground Based Measurements of Aerosols an..." is the property of its rightful owner. Permission is granted to download and print the materials on this web site for personal, non-commercial use only, and to display it on your personal computer provided you do not modify the materials and that you retain all copyright notices contained in the materials. By downloading content from our website, you accept the terms of this agreement.


Presentation Transcript

Slide1

Ground Based Measurements of Aerosols and Precipitation

Douglas B. CollinsPrather Research GroupUniversity of California, San DiegoCalWater2 Planning Workshop – 23 April 2014Slide2

UCSD/SIO Mobile Laboratory

Field-Deployable Platform20’ x 7’ Double Axle Box Trailer

GVWR: 7000 lbs.

Power: 100 A (220 V) Max

Aerosols

Composition (

d

= 0.1 – 3

μ

m)

: Aerosol Time-of-Flight Mass Spectrometers (ATOFMS, x2)

Size Distributions (

d

= 0.01 – 20

μ

m)

: Scanning Mobility Particle

Sizer

, Aerodynamic Particle

Sizer

Light Absorption/Black Carbon

: 7-wavelength

Aethalometer

Cloud Condensation Nuclei (CCN)

: Single Column CCN Counter, Condensation Particle Counter

PM

2.5

Mass

: Beta Attenuation Monitor (BAM)

Others

: Continuous Flow Diffusion Chamber (Ice Nuclei;

DeMott

, Colo. State. Univ.)

Aerosol Ion Chromatography, Aerosol and CCN Capillary Electrophoresis (Roberts, SIO)

Trace Gases

Carbon Monoxide (CO), Nitrogen Oxides (

NOx

), Ozone (O

3

), Sulfur Dioxide (SO

2

)Slide3

CalWater Field Sites

BBY

SPD

MPI

UCSD/SIO Mobile Aerosol Laboratory

Precipitation Sampling (USGS)

Surface Met & Radar (HMT West/NOAA ESRL)

Sugar Pine Dam (SPD): 2009, 2010, 2011

Mariposa (MPI): 2010

Bodega Bay (BBY): 2014

Aerosol Size Distributions & CCN Concentrations

Precipitation Sampling (USGS)

Lincoln (LHM): 2011Precipitation Sampling (USGS)Cazadero (CZC): 2011Shasta Dam (STA): 2011Yosemite Snow Sampling (NPS)Crane Flat (CFT), Badger Pass (BPS),Tuolumne Meadows (TMD): 2011

LHM

STA

CZC

[Google Maps]Slide4

Sugar Pine Dam

Foresthill Backcountry, Tahoe National Forest

BBY

SPD

MPI

LHM

STA

CZD

[Google Maps]

Elevation

: 1066 m MSL

Locale

: Remote, Rural (>10 km from I-80)

Access

: 20 min drive from nearest lodging;

¼ mile hike from road (snow only)

Communications

: Satellite Internet (HughesNet) [No cellular or satellite phone reception]

Notable features

:

Low aerosol concentrations (esp. coarse mode)

Sierra Barrier Jet/Aerosol interactions

New Particle Formation after precipitation

Snow and Rain both possible at ground level

[Late January – Mid March]Slide5

Sugar Pine Dam

Foresthill Backcountry, Tahoe National Forest

Elevation

: 1066 m MSL

Locale

: Remote, Rural (>10 km from I-80)

Access

: 20 min drive from nearest lodging;

¼ mile hike from road (snow only)

Communications

: Satellite Internet (

HughesNet

) [No cellular or satellite phone reception]Notable features:Low aerosol concentrations (esp. coarse mode)Sierra Barrier Jet/Aerosol interactionsNew Particle Formation after precipitationSnow and Rain both possible at ground level[Late January – Mid March]Ambient Particle SourcesSlide6

Bodega Bay

UC Davis Bodega Marine Laboratory

BBY

SPD

MPI

LHM

STA

CZD

[Google Maps]

Elevation

: <10 m MSL

Locale

: Coastal, active laboratory

Access

: Lodging onsite

Communications

: via Bodega Marine Lab

Notable features:Strong contribution from marine aerosol

Central Valley influence via Petaluma Gap

Coastal barrier jet formation

Local burning (campfires), especially on weekends can complicate regional scale signal

[February – March]Slide7

Elevation

: <10 m MSLLocale: Coastal, active laboratoryAccess: Lodging onsiteCommunications: via Bodega Marine Lab

Notable features

:

Strong contribution from marine aerosol

Central Valley influence via Petaluma Gap

Coastal barrier jet formation

Local burning (campfires), especially on weekends can complicate regional scale signal

Bodega Bay

UC Davis Bodega Marine Laboratory

[February – March]

Ambient Particle SourcesSlide8

Elevation

: <10 m MSLLocale: Coastal, active laboratoryAccess: Lodging onsiteCommunications: via Bodega Marine Lab

Notable features

:

Strong contribution from marine aerosol

Central Valley influence via Petaluma Gap

Coastal barrier jet formation

Local burning (campfires), especially on weekends can complicate regional scale signal

Bodega Bay vs. Sugar Pine Dam

BBY has larger coarse mode, which consists of mostly sea spray aerosol

Bodega Bay

UC Davis Bodega Marine Laboratory

[February – March]Slide9

Comparative Analysis

Sugar Pine Dam (Tahoe National Forest)ProsEstablished aerosol dataset (3 years)Possibility for various phases of precip

Receptor site for SNR Orographic

Precip

Clean, remote site

Cons

Poor communication,

very

remote

Access can be blocked for >24

hrs

(snow)

[Can require heavy equipment]Power can be lost for >24 hrs (snow)Limited relationship to cloud chemistryBodega Bay (Bodega Marine Lab)

ProsAccess to supplies, bio lab, office space

Housing is on-site  data consistency

Often receives clean marine airPetaluma gap flow, coastal jet, new particle formation

Backup power is provided (although it pollutes the air heavily)

ConsSalty air can be problematic for electronics

Conditions (and sources) can change very quickly, real-time forecasting necessary

Occasional local pollution (easy to filter)Slide10

Adding Value with Co-Location

Thoughts for Future:LIDAR, Cloud RadarSnow Pillow and SWEHydrometeor Size Distributions

Sugar Pine Dam, 2011

Bodega Bay, 2014

Precip

Aerosol

S-PROF

DRUM

Aerosol

449 MHz

+ RASS

PrecipSlide11

Logistical Considerations

UCSD/SIO Mobile Lab needs near-constant attentionAccess and communications must be reliable

Influence of local particle sources can overshadow regional-scale trends

C.

McCluskey

, Colo. StateSlide12

Thank You!Slide13
Slide14

Mariposa- Yosemite Airport

Mariposa, CA

BBY

SPD

MPI

LHM

STA

CZD

[Google Maps]

Elevation

: 670 m MSL

Locale

: Rural, active road and air traffic

Access

: Short drive to lodging

Communications: Generally available

Notable features:Airport and truck traffic influenced signalSBJ appeared to influence aerosol (like SPD)

Not strongly coupled to Central ValleyStrong local sources of particles make this site not a good option for

CalWater