/
International Journal of Scientific  Technology Resear International Journal of Scientific  Technology Resear

International Journal of Scientific Technology Resear - PDF document

olivia-moreira
olivia-moreira . @olivia-moreira
Follow
400 views
Uploaded On 2015-05-22

International Journal of Scientific Technology Resear - PPT Presentation

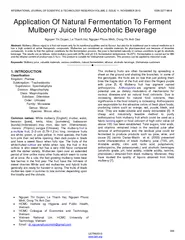
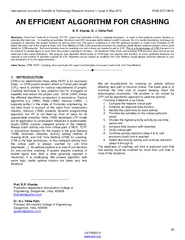
ijstrorg AN EFFICIENT ALGORITHM FOR CRASHING B R Kharde G J Vikhe Patil Abstracts Time Cost Trade off in Projects TCTP Least Cost Schedule LCS or crashing technique is used to find optimum project duration to minimize the total cost In crashing an ac ID: 72044

ijstrorg EFFICIENT ALGORITHM FOR

Share:

Link:

Embed:

Download Presentation from below link

Download Pdf The PPT/PDF document "International Journal of Scientific Tec..." is the property of its rightful owner. Permission is granted to download and print the materials on this web site for personal, non-commercial use only, and to display it on your personal computer provided you do not modify the materials and that you retain all copyright notices contained in the materials. By downloading content from our website, you accept the terms of this agreement.


Presentation Transcript

International Journal of Scientific & Technology Research Volume 1, Issue 4 , May 2012 ISSN 2277 - 8616 94 IJSTR©2012 www.ijstr.org AN EFFICIENT ALGORITHM FOR CRASHING B. R. Kharde, G. J. Vikhe Patil Abstracts : Time - Cost Trade - off in Projects (TCTP), Least - Cost Schedule (LCS) or crashing technique is used to find optimum project duration to minimize the total cost. In crashing an activities, the direct cost (DC) increases while indirect cost(IC) reduces. So i t is double beneficiary technique for managers to decrease the project duration as well as total cost. The goal in crashing is to find the optimum duration or Leas t Cost Schedule (LCS) where the total cost of the project is least. Unit Time Method (UTM) is the powerful procedure for crashing; yields always optimum solution and is used widely for CPM networks. But much iteration (one for crashing one unit of time) are needed to get to LCS. This is a disadvantage of UTM if project is to be crashed for double figure or more time. Say project crashing for 30 days – 30 iterations! Other short cuts avoiding UTM are error porn and errors are observed in few cases (literature). We propose new algorithm which works on UCM logic but requires less iteration. In some problems iterations are reduced to just number of activities crashed till LCS. Algorithm can be viewed as modified Unit Time Method; would always yie ld the optimum in very less iterations (10 to 30% approximately). Index Terms - CPM, PERT, Crashing, time - c ost trade - off, Least Cost Schedule, Economic Crash Limit, Unit Time Method ——————————  —————————— 1. INTRODUCTION CPM is for deterministic times while PERT is for stochastic times. In CPM project duration which is Critical path length ( CPL) need to shorten for various requirements of project. Crashing technique is very powerful tool for managers to expedite and reduce the project cost . Smith (1997) shows the different algorithms comparison in excursions . Various algorithms ( Liu (1995) , Reda (1989), Senouci (1996 ) …) basically written in th e angle of Computer engineering, do not take much in account of the users from construction industr y . Senouci (1996) presents dynamic programming approach, but DP is not liked by most of users for its questionable simplicity. Reda (1989) developed LPP model but its application to construction industries is questionable. Gupta (2006) crashes cheapest activ ity of the network . Always crash activity only from critical path; if MCS, TCTP or economical duration for the project is the goal Steven s (1996) illustrat es networks, dummy adding method of drawing AOA, and Unit Time Method ( UTM) for crashing. UTM is the best techniques. In this cheapest activity from the critical path is always crashed for unit time ( day/week/…). Its optimal solution is at cost of one - iteration for one - unit - time crashing. If project requires crashing of double figure time ( that is what generally required in industries ) ; it is challenging. We present algorithm , with same l ogic, yields optimal solution but takes very less iterations. We set bounds /limits for crashing an activity without affecting next path to become critical. The basic goal is to minimize the total cost of project keeping intact the technological constraints. The problem is not solved by LP P; but by algorithmic approach to yield the optimal. Crashing a Network is as follow: 1. Compute the network critical path 2. Establish an objective total duration 3. Identify the crash time for each a ctivity 4. Prioritize the activities on the critical path (cost slope) 5. Shorten the highest - priority activity by one time period and 6. compare total duration with objective 7. Verify critical path 8. Continue activity reduction (step 4 & 5) until economic crash limit is reached 9. Select next priority activity and continue reduction (steps 4 through 6) The weakness of crashi ng unit time is explored such that one activity could be crashed for more than unit time in most of the situations. ________________________ Prof. B.R. Kharde, Production department, Amrutvahini College of Engineering, Sangamner, India, 422608 khardebr@yahoo.com Dr. G.J. Vikhe Patil, Principal, Amrutvahini College of Engineering, Sangamner, India, 422608 gjvploni@yahoo.co.in International Journal of Scientific & Technology Research Volume 1, Issue 4 , May 2012 ISSN 2277 - 8616 95 IJSTR©2012 www.ijstr.org 2. NOTATION i S tart event ' i ' for an activity j End event 'j ' for an activity A ij Activity having start event ' i ' and end event 'j' T ij time or duration for A ij NT ij Normal time for A ij CT ij Crash time for A ij  ij NT ij - CT ij  K NT K - CT K NC ij Normal Cost for A ij CC ij Crash Cost for A ij CS ij Cost slope for A ij = CC ij - NC ij = ----------------------- NT ij - CT ij CS K Cost slope for Activity K T CS ij =  CS ij for least cost slope activities from different CPs = CS ij for least cost slope activity from critical path CL ij Crash length for activity ij = CT ij - CT ij NC ij Normal Cost for A ij CP K Project path "K" which happens to be critical CPL K Length for critical path 'K , CP K =  T ij for A ij  K NP K the path of the project just shorter(Next) to critical path 'K' NP K N NP K the path of the project just shorter(Next) to NP K path 'K' N P K NPL K Length (duration) for the path of the project just shorter(Next) to critical path 'K" CP NK =  T ij for A ij  N N N PL K Length (duration) for the path of the N NP K F K Critical Path(K) Float Limit or Difference between critical path length and length of next to critical path = CPL K - NPL K NF K Critical Path(K) Float Limit or Difference between critical path length and length of next to next to critical path , = CPL K - N NPL K CTL ij Crash - Time - Limit or maximum limit activity ' i - j ' could be crashed in one stretch , = min { F K , ( NT ij - CT ij )} N CTL ij Crash - Time - Limit or maximum limit activity ' i - j ' could be crashed in one stretch when crash activity is common to C P and NP , = min { N F K , ( NT ij - CT ij )} = min { NF K ,  ij ) 3. NETWORK AND CRITICAL PATH We use Activity On Arc (AOA) h owever AON network could be used . Crashing could be done without network preparation by path table . Critical Path Float Limit Projects have many paths which are evident from the network. These paths are denoted by number, 1 , 2, 3 … , K , … (Table 3.1) Each path has length . Critical path/s is/are t he path/s with longest duration. This length is denoted by CPL K . The path which is just shorter than critical path ( K ) is denoted by N P K and its length by N PL K . Definition : T he difference in these two paths is defin ed as Critical Path Float Limit, F K = CPL K - NPL K Activities on critical path have no floats. All floats for critical activities are zero ( Total Float, Free float, Safety float, Independent float, and Interfering float) . The new definition is not activity float but path float. Figure: 3 .1 Consider AOA network showing activity durations in Figure 3 .1. Three different paths are evident as listed in Table 3 .1. Table 3. 1 – Path Table Path Length 1 1 - 3 - 5 - 6 8+6+9 = 23 2 1 - 3 - 4 - 6 8+4+3 = 15 3 1 - 2 - 4 - 6 5+2+3 = 10 5 8 1 3 4 4 6 9 3 2 6 5 2 International Journal of Scientific & Technology Research Volume 1, Issue 4 , May 2012 ISSN 2277 - 8616 96 IJSTR©2012 www.ijstr.org  The network have three paths namely path 1, 2 and 3 . Path 1 is longest and hence critical path; CP 1 have length CP L 1 = 23 week .  Next path just short to critical path is path 2 and its length is 1 5 weeks. T his path is relative to critical path 1; N P 1 have length N PL 1 = 1 5 week.  The difference between these paths is 8 . So with notations, it is Critical P ath F loat L imit for critical path 1 : F 1 = CPL 1 - NPL 1 = 23 - 15 = 8 week When activity on CP is crashed, the length of C P would be reduced by crashed time. Its effect on NP is observed:  Case 1: N o change in NPL  Case 2: NPL reduction E.g . If activity 3 - 5 is crashed by 1 week, then CPL 1 = 23 - 1 = 22 week NPL 1 = 15 NPL unchanged F 1 = 22 - 15 = 7 week Instead of crashing 3 - 5, if common activity to CP and NP ; 1 - 3 is crashed by 1 week then : CPL 1 = 7+6+9 = 22 week NPL 1 = 7+4+3 = 14 week NPL 1 is reduced from 15 to 14 week F 1 = 22 - 14 = 8 week Theorem 1 : If activity on CP is crashed by unit time ; NP L might be unchanged or would also reduce by unit time . Theorem 2: If activity on CP is crashed by unit time ; Critical Path Float Limit might be reduced by unit time or unchanged . In Case 2 : Critical Path Float Limit is unchanged, and have no effect on criticality ( CP is CP and NP is NP ). This would continue till common activity which is being crashed ; could not be crashed any further . But consider case 1 ; here for crashing one time unit, CPL reduces by one unit but NPL unchanged. So the crashing could continue for one more time unit , so on. A time would come when CPL and NPL are equal or both are CP. The situation changes now, crashing can not be done with logic of one CP. This point is when CP is crashed by the difference in (CPL – NPL) or Critical Path Float limit ( F K ). This is the worst case situation. This infers: Theorem 3 : A ctivity on CP could be crashed by Critical Path Float L imit without affecting Criticality of NP ( CP is CP and NP is NP) . Please note cost economics is not considered here. Crash - Time - Limit for an Activity Theorem 4 : Any a ctivity on CP could be crashed maximum to crash period,  ij or ( NT ij - CT ij ). This is technological constraint on the activity and could not be violated . Fro m theorem 3 and 4 it is evident Theorem 5 : Any activity on CP could be crashed to Crash - T ime - Limit in one stage such that C rash - T ime - Limit ; CTLij = min {F K ;  ij } = min { F K ;  K } Theorem 5 is evident because out of two possibilities ( bounds) onl y least bound could be explored in one stage and it will not violate criticality. Our addition of theorem 3, 4 and 5 are implemented in Crashing . Instead of crashing one unit time , activity could be crashed by CTL , without any problem. Crash - Time - Limit for an Activity when it is common on CP and NP When activity 'K' is common to CP and NP; both path s would be shortened after the crashing. Hence F K does not put any constraint on Crash limit . Under such case N NP K should be taken for consideration. for calculation. NF K = CPL K - NNPL K Crash activity is common to CP, NP and N NP; then further path just shorter than N NPL KN should be considered. Such cases are rare but can not be neglected . NCTL for crashing when activity is common in CP and NP , N C TL K = min { N F K ;  ij } = min {NF K ;  K } 4. COST SHEET In literature no common standards are followed for crashing . We use cost sheet format from Steven s (1996) . Cost Sheet 4.1 Activity Crash time Cost slope Time shortened i - j  ij CS ij Time Cut (crash ) //////// Project duration Incremental Cost //////// Direct Cost Indirect C ost Total Cost Where with notation Time Cut (crash) = CTL ij Project duration = CPL K Incremental cost (IncC) = CTL ij * TCS ij Direct Cost(DC) =  NC ij + InC Indirect cost(IC) = CPL * Indirect cost/time Total cost(TC) = DC + IC International Journal of Scientific & Technology Research Volume 1, Issue 4 , May 2012 ISSN 2277 - 8616 97 IJSTR©2012 www.ijstr.org 5. ALGORITHM USING CRASH - TIME - LIMIT (CTL) FOR CRASHING We propose CTL algorithm as follow: Step 1 : Prepare table showing activity, Immediate Predecessors, Normal time, Crash time, Normal cost and Crash cost for each activity Tabulate cost slope ( CS ij ) or incremental cost per unit time for each activity CS ij = ( CC ij - NC ij ) / (NT ij - CT ij ) Step 2 : Prepare Cost - sheet with CS and CTL, Direct and Indirect cost, Step 3 : Prepare AON or AOA diagram. Show NT on network. Prepare a P ath - table showing different paths and find lengths of the each path. Note CP , NP , CPL, NPL and F K from P ath table.( No need to run Forward / backward passes ) Step 4 : Noting CPL, prepare ( 1st column of ) Cost - Sheet and Total Direct cost(TNC), Total Indirect cost and Total cost of the project Step 5 : If no activity from any one CP could not be crashed, Then Stop, It is crash limit. If more than one critical path (CP) , then go to Step 6, Else go to step 7 Step 6 : If any activit y/ies is /are common to all CPs which could be crashed T hen note the common activity with least cost slope from CPs (CS C) A nd Note one least cost slope activity which could be crashed * from each CP CSTotal = add cost slope of these activities If ( CSC CSTotal ) then go to step 8 : Else 1. Find Crash T ime Limit for each such activity 2. T ake minimum CTL 3. Reduce each least cost slope activity by minimum CTL 4. Reduce CTL in Network Diagram 5. Update path Table and note CPs, new CPL, new F K 6. Update Cost sheet for this CPL (Total Incremental cost, D C , Indirect Cost and TC) 7. Go To Step 9 Step 7 : Note the activity ( K) with least cost slope which could be crashed * from CP ,. If crash activity(K) is common to CP and NP ; Then crash it by NCTL K ; Else crash by CTL ij Step 8 : 1. Find CTL or NCTL as applicable 2. Reduce activity to be crashed (K) by CTL or NCTL as applicable in network 3. Update Path table. 4. Find CP, CPL, F K 5. Update Cost sheet for CPL (Total incremental cost, DC, IC, TC) Step 9 : If Total cost of the project is increased Then Stop; least total cost is the optimum period; solution; Else go to Step 5: 6. ILLUSTRATION Problem data is given in table 6 .1 and AOA network diagram 6.1 Table 6.1 Activity IP Duration (days) Cost ('000 $) - event Normal Crash Normal Crash - ' i – j' NT ij CT ij NC ij CC ij A 1 - 2 - 20 14 1600 2170 B 2 - 4 A 10 6 140 220 C 2 - 3 A 20 12 800 1720 E 4 - 5 B, C 40 30 800 1050 F 3 - 5 C 10 8 1000 1050 Indirect cost of the project is $ 100,000 per day Step 1: prepare Cost - Slope Table ( Table 6 .2 ) Table 6.2 : Cost - Slope Table Activity IP Duration (days) Cost ('000 $)  time Cost Slope - event Normal Crash Normal Crash NT ij - CT ij CS ij ('000 $/day) - ' i – j' NT ij CT ij NC ij CC ij A 1 - 2 - 20 14 1600 2170 6 95 B 2 - 4 A 10 6 140 220 4 20 C 2 - 3 A 20 12 800 1520 8 90 E 4 - 5 B, C 40 30 800 1050 10 25 F 3 - 5 C 10 8 1000 1050 2 25 TOTAL 4340 International Journal of Scientific & Technology Research Volume 1, Issue 4 , May 2012 ISSN 2277 - 8616 98 IJSTR©2012 www.ijstr.org Step 2: prepare Cost sheet ( Table 6 . 3) Table 6.3 - Cost Sheet Activity  time CS ij Days shortened days '000 $/day A 6 95 B 4 20 C 8 90 E 10 25 F 2 25 Days cut ///////////////// Project duration (CPL) 80 Incremental cost (IncC) ///////////////// Direct cost (DC) 4340 Indirect cost (IC) 8000 Total cost (TC) 12340 Step 3: AOA network is prepared ( Figure 6 .1 ) Figure: 6.1 – AOA Network 1. Prepare Path table ( table 6 . 4) Table 6. 4 - Path Table Path I A - B - E 20+10+40 = 70 II A - C - D o - E 20+20+40 = 80 * II A - C - F 20+20+10 = 50 Critical path, CP II Critical path duration, CPL 80 Next to CP length, NPL 70 Critical path float limit, F 10 NCP Float limit, NF 20 Column i Step 4: update Cost Sheet ( data to be put in Table 6.3) Days cut ////////////////// Project duration , CPL II 80 days Incremental cost (IncC) /////////////////// Direct cost (DC)  NC ij = 4340; IncC = 0 ; DC = 4340 Indirect cost (IC) CPL * Indirect cost/time = 80* 100 = 8000 Total cost (TC) = DC+ IC = 12340 Step 5: CP is path II; Only one path; go to Step 7 : D o 4 10 40 1 2 3 5 10 20 20 A B C F E International Journal of Scientific & Technology Research Volume 1, Issue 4 , May 2012 ISSN 2277 - 8616 99 IJSTR©2012 www.ijstr.org Step 7 : Path II is critical path ; Critical a ctivities are A, C and E (from Path table , path II ) . From Cost sheet: CS A = 95; CS C = 90; and CS E = 25 *****  Least cost slope activity is E from CP ; It is common to CP (II) and NP (I) but not common to NNP (III) NF II = CPL II - NNPL III = 80 - 50 = 30 days NCTL II = min { NF II ;  E } = min { 30,10 } = 10 days. Activity E to be crashed by 10 days Step 8:  Activity 'E' is reduced by 10 days in network  Update Network.  Update Path table (column ii; Table 6. 5 - not shown ) . CP is path II; CPL II = 70 days ; NP is path I ; NPL II = 60 days ; F II = 70 - 60 = 10 days 1. Cost sheet updating ( Cost - Sheet 6.4 - A) : Activity E is crashed by 10 days;  E is reduced by 10 days from 10 to 0; Days cut = CTL = 10 days ; Activity E is crashed by 10 days @ CS E IncC = 10 * CS E = 10 * 25 = 250 DC = 4340 + 250 = 4590; IC = 100 * 70 = 7000; and TC = DC + IC = 4590 + 7000 = 11590. Step 9: TC (previous) = 12340; TC (after crash) = 11590 . As Total cost is reduced, go to step 5: Step 5: Critical path is path II; only one. go to step 7: Step 7: Path II is critical path; Critical Activities which can be crashed ; are A and C (from Cost sheet; E have  E = 0 ). From Cost sheet: CS A = 95 and CS C = 90** Least cost slope activity is C and  C = 8 days (From Cost sheet) So Activity C could be crashed . Activity C is not common to CP and NP . For activity C;  C = 8 days (cost sheet) and F II = 10 days (Path table) CTL C = min {  C ; F II } = min {8, 10} = 8 day Activity 'C' to be crashed by 8 days Step 8: Activity ' C ' is reduced by 8 days in network 1. U pdate Network . 2. Update Path table (column iii; Table 5.3) : CP is path II; CPL II = 62 days ; NP is path I ; NPL II = 60 days ; F II = 62 - 60 = 2 days 3. Cost sheet updating: Activity C is crashed by 8 days;  C is reduced by 8 days from 8 to 0; Days cut = CTL = 8 days . Activity C is crashed by 8 days@ CS C . IncC = 8 * CS C = 8 * 90 = 720 . D C = 4590 + 720 = 5310 ; I C = 100 * 62 = 6200 and TC = DC + IC = 5310 + 6200 = 11510 Step 9: TC (previous) = 11590 and TC (after crash) = 11 510 . Total cost is reduced , go to S tep 5: Step 5: Cri tical path is path II; only one; go to step 7: Step 7: Path II is critical path;  Critical Activities are A, C and E (from Path table).  From Cost sheet: on ly Activity A could be crashed.  As  E =  C = 0; CS A = 95 ***  Least cost slope activity is A ; It is common to CP (II) , NP(I) and NNP(III) . It does not constraint the F II . However finding NCTL : NF II = CPL II - NNPL III = 56 – 36 = 20; NCTL II = min { NF II ;  K } = min { 20,6 } = 6 days Activity A to be crashed by 6 days Step 8: 1. Activity ' A ' is reduced by 6 days in network 2. Update the Network: Update the Path table ( column iii; Table 5.3) : CP is path II; CPL II = 56 days; NP is path I ; NPL II = 54 days; F II = 56 - 54 = 2 days Cost sheet updating: Activity C is crashed by 6 days;  A is reduced by 6 days from 6 to 0; Days cut = CTL = 6 days; Activity A is crashed by 6 days @ CS A IncC = 6 * CS A = 6 * 95 = 570; DC = 5310 + 570 = 5880; IC = 100 * 56 = 5600; and TC = DC + IC = 5880 + 5600 = 11480 Step 9: TC (previous) = 11510 and TC ( after crash) = 11480 Table 6.3 - A: Cost - Sheet (partial) Acti - vity  time CS ij Days short - ened days A 6 95 * B 4 20 C 8 90 * E 10 , 0 25 10* F 2 25 Days cut ////////// 10 Project duration (CPL) 80 70 Incremental cost (IncC) ////////// 250 Direct cost (DC) 4340 4590 Indirect cost (ID) 8000 7000 Total cost (TC) 12340 11590 Step 5: Critical path is path II; only one hence go to step 7: International Journal of Scientific & Technology Research Volume 1, Issue 4 , May 2012 ISSN 2277 - 8616 100 IJSTR©2012 www.ijstr.org At end Figur e 6.1 is as shown below Figure: 6.1 – AOA Network (final) At end Path table (Table 6.4) is as shown below Table 6.4 - Path Table (final) Path I A - B - E 20+10+40 = 70 60 60 54 II A - C - D o - E 20+20+40 = 80 * 70 * 62 * 56 * II A - C - F 20+20+10 = 50 50 42 36 Critical path, CP II II II II Critical path duration, CPL 80 70 62 56 Next to CP length, NPL 70 60 60 54 Critical path float limit, F 10 10 2 2 NCP Float limit, NF 20 20 20 20 Column i ii iii iv v At end Cost - Sheet (Table 6.3) is as shown below Table 6. 3 - Cost Sheet (final) Activity  time CS ij Days shortened days '000 $/day A 6 95 * * * 6 - B 4 20 C 8 90 * * 8 - - E 10 25 * 10 - - - F 2 25 Days cut ///////////////// 10 8 6 Project duration 80 70 62 56 Incremental cost ///////////////// 250 720 570 Direct cost 4340 4590 5310 5880 Indirect cost 8000 7000 6200 5600 Total cost 12340 11590 11510 11480 Step 7: Path II is critical path;  No Critical Activities can be crashed as (from Cost sheet)  E, C and A have:  E =  C =  A = 0;  No activity from critical path could be crashed. Economic Crash limit is obtained  Stop. Solution: Least cost schedule = 56 days and Total minimum cost = $ 11 , 480 , 000 Crashing needed: Activity Crashed by Days Crash Cost ($) A 6 570,000 C 8 720, 000 E 10 250,000 * Critical activities - Activity can not be crashed any further 4 10 40 , 30, 1 2 3 5 10 20 , 12 20 , 14 A B C D o F E International Journal of Scientific & Technology Research Volume 1, Issue 4 , May 2012 ISSN 2277 - 8616 101 IJSTR©2012 www.ijstr.org 7. CONCLUSION : The new algorithm has given the solution for test problem in three iterations . This solution by Unit Time Method would require 10+8+6 = 24 iterations . It requires fewer efforts for manual solutions . Definitely this test problem can not be solved manually ( 24 iterations!) while with our algorithm it is possible . 1. New algorithm requires fewer iterations (12% or 3/24 in test problem) 2. It quickly gives the optimum solution 3. It finds application for almost all problems in CPM 4. Definitely this is great addition in literature 5. CTL Algorithm has been framed for more critical paths. 6. Its application to PERT or stochastic times is still area for further research 7. I ts application when more than five or more critical paths exits ; is also an area for further research REFERENCES : 1. Arisawa, S. and Elmaghram, S. E. (1979) , Optimal time - cost trade - off in GERT Networks . Management Science, 8(11): 589 - 599. 2. Hillier, F. S., M. S. Hillier and G. J. Lieberman , (2000), Introduction to Management Science , Irwin - McGraw - Hill, Boston, 3. Gupta , P . K . and Hira D . S . (2006), "Network Analysis in Network Planning"; Operations Research; book , p p 1141 - 1244 4. Liu, L., Burns, S. and Feng, C. (1995b) Construction Time - Cost Trade - off Optimization System, Proceedings: The Second Congress held in Conjunction with A/E/C ystems ’95 , Atlanta, GA, ASCE, Vol. 2, 5 - 8 June, pp. 1142 - 1149. 5. Reda et al . (1989), " Time - Cost Trade - off Among Related Activities, Journal of Construction Engineering and Management , ASCE, Vol. 115, No. 3, pp. 475 - 486. 6. Robinson, D.R. (1975) , A Dynamic Programming Solution to Cost - Time Trade - off for CPM, Management Science , Vol. 22, No. 2, pp. 158 - 166. 7. Sakellaropoulos et al (2004), " Project time - cost analysis under generalized precedence relations " . Advances in Engineering Software, 35; pp 715 - 724. 8. Senouci A.B. and Eldin N.N. (1996), "A time - cost trade - off algorithm for non - serial linear projects", Canadian J. of Engineering , Vol.23, pp.134 - 149. 9. Siemens, N. (1971) " A Simple CPM Time - Cost Trade - off Algorithm " , MS , Vol. 17. No. 6, pp. B - 354 - 363. 10. Smith , L.A. (1997) , "Comparing Commercially Available CPM/PERT Computer Programs", Journal of IE , Vol. 10, N°4, 11. Steven s , J . D . (1996) , " Techniques for Construction Network Scheduling ", 12. Talbot, F.B. (1982), ―Resource Constrained Project Scheduling with Time - Resource Tradeoffs:‖ Management Science , Vol. 28, pp 1197 - 1210. 13. Vora , N . D . (2005), " PERT and CPM"; Quantitative techniques in management; book, pg 537 - 596