PPT-Rasterization Overview Raster Display Device
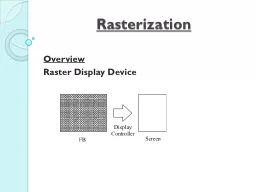
Scan Conversion Rasterization converting vector graphics into raster graphics determining pixels in raster graphics to represent primitives in vector graphics Scan
Download Presentation
"Rasterization Overview Raster Display Device" is the property of its rightful owner. Permission is granted to download and print materials on this website for personal, non-commercial use only, provided you retain all copyright notices. By downloading content from our website, you accept the terms of this agreement.
Presentation Transcript
Transcript not available.