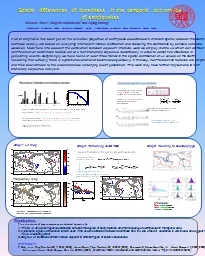
/
Spatial differences of burstiness in Spatial differences of burstiness in

Spatial differences of burstiness in - PowerPoint Presentation

olivia-moreira
olivia-moreira . @olivia-moreira
Follow
346 views
Uploaded On 2018-12-05

Spatial differences of burstiness in - PPT Presentation

the temporal occurrence of earthquakes Xiaoxue Zhao 1 Shigeru Shinomoto 2 and Jiping Huang 1 1 Department of Physics Fudan University Shanghai China 2 Department of Physics Kyoto University Kyoto Japan ID: 736373

event burstiness correlation spatial burstiness event spatial correlation phys distribution shinomoto structures rev lett comput metric areas earth map values adjacent features

Share:

Link:

Embed:

Download Presentation from below link

Download Presentation The PPT/PDF document "Spatial differences of burstiness in" is the property of its rightful owner. Permission is granted to download and print the materials on this web site for personal, non-commercial use only, and to display it on your personal computer provided you do not modify the materials and that you retain all copyright notices contained in the materials. By downloading content from our website, you accept the terms of this agreement.


Presentation Transcript

Slide1

Spatial differences of burstiness in the temporal occurrenceof earthquakes

Xiaoxue Zhao1, Shigeru Shinomoto2 and Jiping Huang1 1 Department of Physics, Fudan University, Shanghai, China 2 Department of Physics, Kyoto University, Kyoto, Japan

A lot of emphasis has been put on the universal properties of earthquake occurrences in different spatial areas on the Earth. Methods usually are based on analyzing inter-event interval distribution and rescaling the distribution by suitable variables. However, fewer take into account the correlation between adjacent intervals. Here we employ metric Lv, which can abstract non-Poissonian burstiness feature out of a non-stationary sequence (burstiness), in order to detect fine structures in generating events.

Surprisingly

we have found at least three trends in the

spatial distribution of Lv values on the Earth, indicating that actually there is systematic variation of burstiness spastically. In this way, non-Poissonian features are amplified and thus bear witness to the circumstances underlying event generation. This work may have further implications to non-stationary sequence analysis.

Conclusions:Fine structures of event occurrence are detected by metric Lv: There is an overall negative correlation between the degree of busty features and the frequency of earthquakes in that spatial area. systematic regional differences remain even if the overal correlation between burstiness and the rate of event ccurrence is eliminated, and appear to have clustering effectDegree of burstiness differs in areas adjacent to different types of tectonic boundaries.References:P Bak, et al. Phys. Rev. Lett 88, 178501 (2002); Alvaro Corral, Phys. Rev. Lett. 92, 108501 (2004); Shinomoto S, Shima K and Tanji J, Neural Comput 15, 2823 (2003) ; Shinomoto S et al. PLoS Comput. Biol. 5, e1000433 (2003) ; X.X.Zhao, T.Omi, N.Matsuno, and S.Shinomoto, New J. Phys, 12, 063010 (2010)

Extension to N oscillators

Motivation

Database: NEIC-PDE from 1973.1.1, to 2009.6.30.

longitude width: 6 degrees, area size: 250,000 km

2

Step1:

Lv

map

Frequency map

Step2: Removing

overal

trend

Step3: Relating to boundary type

p-values:

ridge

-

trench

4.5e-008

ridge

-

transform

6.2e-004

trench

-

transform

0.46