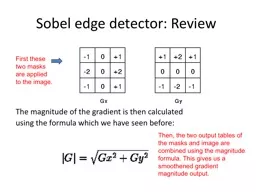
then calculated using the formula which we have seen before First these two masks are applied to the image Then the two output tables of the masks and image are combined using the magnitude formula This gives us a smoothened gradient magnitude output ID: 722064
Download Presentation The PPT/PDF document "The magnitude of the gradient is" is the property of its rightful owner. Permission is granted to download and print the materials on this web site for personal, non-commercial use only, and to display it on your personal computer provided you do not modify the materials and that you retain all copyright notices contained in the materials. By downloading content from our website, you accept the terms of this agreement.
Slide1
The magnitude of the gradient is then calculated using the formula which we have seen before:
First these two masks are applied to the image.
Then, the two output tables of the masks and image are combined using the magnitude formula. This gives us a smoothened gradient magnitude output.
Sobel edge detector: ReviewSlide2
Algorithms for edge detection: ReviewAlgorithm 1: Compute gradientsCompute magnitude Threshold magnitudeSmoothing, followed by Algorithm 1ie
, the Sobel edge detectorThe association property of convolutionsSlide3
Sobel vs. Canny edge detectors: Review
SobelCanny
SmoothingAll ones
/ #onesA Gaussian table/filter
GradientsHorizontal & vertical gradients
Horizontal & vertical gradientsMagnitudes of gradients
Directions of gradients
n/a
tan(
dir
) = Gy / GxFlagsn/aNon-maximum SuppressionThresholdingOne thresholdDouble thresholdingSlide4
Canny Part ThreeNormally called Hysteresis ThresholdingWe call it Double ThresholdingSlide5
Double ThresholdsLet us first review what we have produced so far:
A Magnitude Image A Peaks ImageSlide6
Double ThresholdsTwo thresholds will be usedWill be applied to Magnitude image,
but only to places that have shown up as peaksTwo thresholds, a HIGH and a LOWIf Mag exceeds HI, definitely pass pixel to Final
If Mag lower than LO, definitely never be in finalIf
Mag is between HI and LO, then check if geographically adjacent to a position (pixel) that has made it in to Final; if yes, then pass pixel to FinalSlide7
Double Thresholds The typical way to write this is using Recursion.Simply scan the image, looking only at Peaks, and at each Peak, ask if Mag exceeds HI; if No, do nothing (go on to next peak); if Yes, then call a recursive procedure on each of the 8 neighbors
The recursive procedure must use LO to determine if it should call itself again on the 8 neighbors of the peak it was given. If exceeds LO, call recursion.Slide8
Double Thresholds Since we do NOT assume that all students in class know how to write recursion, here is an iterative, simple-to-follow, but inefficient procedure:
For i, For j if peaks(
ij) == ON if mag(ij
)> HI peaks(ij) = OFF, flags(
ij) = ON else if mag(ij
)< LO peaks(ij)=flags(ij
)= OFF
.
Then, do the WHILE-LOOP from next slide.Slide9
Simple, inefficient cont’dmoretodo=ONWhile
moretodo==ON moretodo= OFF
For i, For j if peaks(ij
) == ON For p (-1 to +1), For q (-1 to +1) if flags(
i+p,j+q) == ON peaks(ij) = OFF,
flags(ij) = ON, moretodo=ON
ALL DONE Slide10
Simple, inefficient : All on One slideFor i, For j
if peaks(ij) == ON if mag(
ij)> HI peaks(ij) = OFF, final(
ij) = ON else if mag(ij)< LO
peaks(ij)=flags(ij)= OFF.
moretodo=ONWhile moretodo==ON moretodo
= OFF
For
i
, For j
if peaks(ij) == ON For p (-1 to +1), For q (-1 to +1) if flags(i+p,j+q) == ON peaks(ij) = OFF, flags(ij) = ON, moretodo=ONALL DONE Slide11
Simple, inefficient cont’d inefficient Case: LLLLLLLL
L L MMMMMMMMMMMMMMM
L M
L HHHH M L M M
M L M M M
L MMMMMMMM M M M
M
M
MMMMMMMMMMMMMMMMMM
Thankfully, most M-chains are small.Slide12
Canny Part FourAutomatically get HI (and hence LO)Slide13
Automatically Get HI Use Percent as input
Then apply it to histogram of scaled mags In the histogram of scaled mags
, find the Point that exceeds Percent of all, mark that as HI. Then, LO is 0.35 of HI Slide14
Details of Automatically Get HIRead Percent as inputCompute Histogram of scaled magnitudes
CutOff = Percent*Rows*Colsfor (i=
HistogramSize downto 1, i--)
AreaOfTops += Histogram[i] if (
AreaOfTops>CutOff) Break out of for-loop
HI=ILO= .35*HI
Histogram of scaled magnitudes obtained by:
for i, for j
(Histogram[Magnitude[
I,j
]])++Slide15
Details of Automatically Get HI In the histogram of scaled mags
, find the Point that exceeds Percent of all, mark that as HI.
x xxx x xx
xxxxx xx xx
x xx xxx xxxxxx xxx xx
xx xxx xxxx x xxxxx
xxxxxxx
xxxx
xxx xx
xxxx xxxxxx xxx xxxxxx x xxxxxxxx xxxxx xxxx xxxx xxxxxxxxxxxxxxxx x xxxxxxx xxx xxxxxxxxxxxxxxx xxxxx xxxx xxxxxxxxxxxxxxxxxx xxx xxxxxxxxx xxxx xxxxxxxxxxxxxxxxxxxxxxxxxxxxxxxxxxxxxxxxxxxxxxxx
xxxxxxxxxxxxxxxxxxxx -------------------------------------…----------------- Slide16
Complete Canny Algorithm Part One: Compute Gradient Magnitude
Part Two: Compute PeaksPart Four: Automatically Computer HI and LOPart Three: Double ThresholdSlide17
SobelCanny
SmoothingAll ones / #ones
A Gaussian table/filter
GradientsHorizontal & vertical gradients
Horizontal & vertical gradientsMagnitudes of gradients
Directions of gradients
n/a
tan(
dir
) =
Gy / GxFlagsn/aNon-maximum SuppressionThresholdingOne thresholdDouble thresholdingAutomatically choose thresholdsApplicable
ApplicableSlide18
About the example code marrh.c
-- Marrh.c uses flexible size masks (which we need), we will keep
this part of the code. --
Marrh.c uses second derivatives, whereas we need only first derivatives (we need first x- and y- derivatives), so we will change the equation in the marrh.c
line to be the first x-derivative. Read and delete this part
-- Then, because we need two derivatives, we will double up on that line, i.e., make a copy of it to compute the y-derivative, finally ending up with two masks (xmask
and
ymask
).
See
sobel.c for reference. Slide19
Canny Algorithm, Part One -- Then use the convolution code from marrh
but remember to double up on it, to get two outputs. A good example showing how to do convolution.
-- Then delete the code in marrh that is below the convolution code.
-- Then bring in the sqrt (of squares) code from sobel. This will compute the magnitude, will scale it for output, and will print it out.
-- At this point, you are done with Canny part One, and your code should produce output very similar to the Sobel magnitude image.
Slide20
Notetaker Needed for CAP 4453.0001 - Earn up to 40 hours of community service