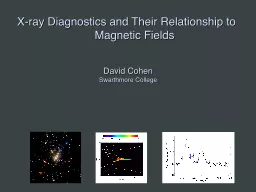
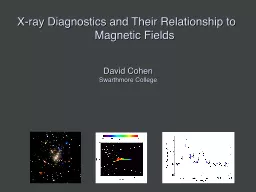
David Cohen Swarthmore College If we understand the physical connection between magnetic fields in massive stars and Xrays we could use Xray observations to identify magnetic massive stars eg Which of the stars in this Chandra Xray image of the Orion Nebula Cluster are massive magnetic st ID: 353577
Download Presentation The PPT/PDF document "X-ray Diagnostics and Their Relationship..." is the property of its rightful owner. Permission is granted to download and print the materials on this web site for personal, non-commercial use only, and to display it on your personal computer provided you do not modify the materials and that you retain all copyright notices contained in the materials. By downloading content from our website, you accept the terms of this agreement.
Slide1
X-ray Diagnostics and Their Relationship to Magnetic Fields
David CohenSwarthmore CollegeSlide2
If we understand the physical connection between magnetic fields in massive stars and X-rays, we could use X-ray observations to identify magnetic massive stars.
e.g. Which of the stars in this Chandra X-ray image of the Orion Nebula Cluster are massive magnetic stars? Slide3
But we’re not there yet…X-ray behavior of known magnetic massive stars is diverse.
We don’t understand enough about the physical mechanisms of X-ray production in them.Slide4
The Sun: X-rays <-> Magnetic FieldsSlide5Slide6
TRACESlide7
low-mass stars
high-mass starsStellar rotation vs. X-ray luminosity
No trendSlide8
Massive star X-rays are not coronalSlide9
X-rays in massive stars are associated with their radiation-driven windsSlide10
Power in these winds:
erg s
-1
while the x-ray luminosity
To account for the x-rays, only
one part in 10
-4
of the wind’s mechanical power is needed to heat the windSlide11
Three models for massive star x-ray emission1. Instability driven shocks
2. Magnetically channeled wind shocks3. Wind-wind interaction in close binariesSlide12
Three models for massive star x-ray emission1. Instability driven shocks
2. Magnetically channeled wind shocks3. Wind-wind interaction in close binariesSlide13
What are these “X-rays” anyway?…and what’s the available data like? Slide14
XMM-Newton
ChandraLaunched 2000: superior
sensitivity, spatial resolution, and
spectral resolution
sub-
arcsecond
resolutionSlide15
XMM-Newton
ChandraBoth have CCD detectors for imaging spectroscopy:
low spectral resolution: R ~ 20 to 50
And both have grating spectrometers:
R
~ few 100 to 1000
300 km/
sSlide16
XMM-Newton
ChandraThe gratings
have poor sensitivity…We’ll never get spectra for more than two dozen hot starsSlide17
XMM-Newton
Chandra
Astro-H (Japan) – high spectral resolution at high photon energies…few years from now
International X-ray Observatory
(IXO)… 2020+
The Future:Slide18
First, imaging (+ low resolution) spectroscopy with ChandraSlide19
q1
Ori C
Chandra
ACIS
Orion
Nebula
Cluster (COUP)
Color coded according to photon energy (red: <1keV;
green
1 to 2
keV
; blue > 2
keV
)Slide20Slide21Slide22
Stelzer et al. 2005
q1 Ori C: X-ray lightcurve
not zeroSlide23
s Ori E: XMM light curve
Sanz-Forcada et al. 2004Slide24
XMM EPIC spectrum of s Ori E
Sanz-Forcada et al. 2004Slide25
z
Pup
1
Ori C
Chandra
grating spectra:
1
Ori C
and a non-magnetic O star Slide26
thermal emission“coronal approximation” valid: electrons in ground state, collisions up, spontaneous emission downoptically thinlines from highly stripped metals, weak
bremsstrahlung continuum (continuum stronger for higher temperatures)Slide27
thermal emission“coronal approximation” valid: electrons in ground state, collisions up, spontaneous emission downoptically thinlines from highly stripped metals, weak
bremsstrahlung continuum (continuum stronger for higher temperatures)Slide28
thermal emission“coronal approximation” valid: electrons in ground state, collisions up, spontaneous emission downoptically thinlines from highly stripped metals, weak
bremsstrahlung continuum (continuum stronger for higher temperatures)Slide29
thermal emission“coronal approximation” valid: electrons in ground state, collisions up, spontaneous emission downoptically thinlines from highly stripped metals
, weak bremsstrahlung continuum (continuum stronger for higher temperatures)Slide30
z
Pup
1
Ori C
Chandra
grating spectra:
1
Ori C
and a non-magnetic O star Slide31
Energy Considerations and Scalings1 keV ~ 12 × 10
6 K ~ 12 ÅROSAT 150 eV to 2 keVChandra
, XMM 350 eV
to 10 keV
Shock heating:
D
v
= 300
km/
s
gives T ~ 10
6
K (and T ~ v
2
)Slide32
Energy Considerations and Scalings1 keV ~ 12 × 10
6 K ~ 12 ÅROSAT 150 eV to 2 keVChandra
, XMM 350 eV
to 10 keV
Shock heating:
D
v
= 1000
km/
s
gives T ~ 10
7
K (and T ~ v
2
)Slide33
z
Pup
1
Ori C
Si XIII
Si XIV
Mg XI
Mg XII
H-like
/
He-like
ratio is temperature sensitiveSlide34
z
Pup
1
Ori C
Si XIII
Si XIV
Mg XI
Mg XII
1
Ori
C – is hotter
H/He > 1 in
1
Ori
C Slide35
Differential Emission Measure
(temperature distribution)
Wojdowski & Schulz (2005)
q
1
Ori
C is much hotterSlide36
1000 km s-1
Emission lines are significantly narrower, too
q
1
Ori C
(O7 V)
z
Pup
(O4 If)Slide37
Mg XII Ly-a in q
1 Ori C compared to instrumental profileSlide38
Ne X Ly-a in q
1 Ori C : cooler plasma, broader – some contribution from “standard” instability wind shocksSlide39
Wade et al. 2008
Dipole magnetic field Slide40
Shore & Brown, 1990Slide41Slide42
There are Chandra observations at many different phasesSlide43
What about confinement? Recall:
q
1
Ori
C:
h
*
~ 20 : decent confinementSlide44
What about confinement? Recall:
q
1
Ori
C:
h
*
~ 20 : decent confinement
z
Ori
:
h
*
~ 0.1 : poor confinement
s
Ori
E:
h
*
~ 10
7
: excellent confinementSlide45
Simulation/visualization courtesy A. ud
-DoulaMovie available at astro.swarthmore.edu/~cohen/presentations/apip09/t1oc-lowvinf-logd.aviSlide46
Simulation/visualization courtesy A. ud
-DoulaMovie available at astro.swarthmore.edu/~cohen/presentations/apip09/t1oc-lowvinf-logT.aviSlide47
Simulation/visualization courtesy A. ud
-DoulaMovie available at astro.swarthmore.edu/~cohen/presentations/apip09/t1oc-lowvinf-speed.aviSlide48
temperature
emission measure
MHD simulations of magnetically channeled wind
Channeled collision is close to
head-on:
D
v
> 1000
km s
-1
: T > 10
7
K
simulations by A.
ud
-Doula;
Gagné
et al. (2005)Slide49
Differential emission measure
(temperature distribution)
MHD simulation of
1
Ori
C reproduces the observed differential emission measure
Wojdowski
& Schulz (2005)Slide50
0.0
0.5
1.0
1.5
Simulation EM (10
56
cm
-3
)
0.0
0.1
0.2
0.3
0.4
θ
1
Ori C ACIS-I count rate (s
-1
)
0.0 0.2 0.4 0.6 0.8 1.0
Rotational phase (P=15.422 days)
Chandra
broadband count rate vs. rotational phase
Model from MHD simulationSlide51
0.0
0.5
1.0
1.5
Simulation EM (10
56
cm
-3
)
0.0
0.1
0.2
0.3
0.4
θ
1
Ori C ACIS-I count rate (s
-1
)
0.0 0.2 0.4 0.6 0.8 1.0
Rotational phase (P=15.422 days)
The star itself occults the hot plasma torus
The closer the hot plasma is to the star, the deeper the dip in the x-ray light curveSlide52
0.0
0.5
1.0
1.5
Simulation EM (10
56
cm
-3
)
0.0
0.1
0.2
0.3
0.4
θ
1
Ori C ACIS-I count rate (s
-1
)
0.0 0.2 0.4 0.6 0.8 1.0
Rotational phase (P=15.422 days)
The star itself occults the hot plasma torus
hot
plasma is
too far from
the
star in the simulation –
the
dip is not deep enoughSlide53
q1 Ori C column density (from x-ray absorption) vs. phase
equator-onpole-onSlide54
Emission measure
contour encloses T > 106 KSlide55
Helium-like species’ forbidden-to-intercombination
line ratios – f/i or z
/
(x+y
)
– provide information about the
location
of the hot plasma
Slide56
g.s. 1s
2
1
S
1s2s
3
S
1s2p
3
P
1s2p
1
P
resonance (w)
intercombination (x+y)
forbidden (z)
10-20 eV
1-2 keV
Helium-like ions (e.g. O
+6
, Ne
+8
, Mg
+10
, Si
+12
, S
+14
) – schematic energy level diagramSlide57
1s2s
3
S
1s2p
3
P
1s2p
1
P
resonance (w)
intercombination (x+y)
forbidden (z)
g.s. 1s
2
1
S
Ultraviolet light from the star’s photosphere drives
photoexcitation
out of the
3
S level
UVSlide58
1s2s
3
S
1s2p
3
P
1s2p
1
P
resonance (w)
intercombination (x+y)
forbidden (z)
g.s. 1s
2
1
S
Weakening the forbidden line and strengthening the
intercombination
line
UVSlide59
1s2s
3
S
1s2p
3
P
1s2p
1
P
resonance (w)
intercombination (x+y)
forbidden (z)
g.s. 1s
2
1
S
The
f/i
ratio is thus a diagnostic of the local UV mean intensity…
UVSlide60
1s2s
3
S
1s2p
3
P
1s2p
1
P
resonance (w)
intercombination (x+y)
forbidden (z)
g.s. 1s
2
1
S
…and thus the distance of the x-ray emitting plasma from the photosphere
UVSlide61
1 Ori CMg XISlide62
R
fir
=1.2 R*
R
fir
=4.0 R
*
R
fir
=2.1 R
*Slide63
He-like f/i
ratios and the x-ray light curve both indicate that the hot plasma is somewhat closer to the photosphere of q1
Ori C
than the MHD models predict. Slide64
So, in q1 Ori C, the X-rays tell us about the magnetospheric
conditions in several ways: High X-ray luminosityX-ray hardness (high plasma temperatures)Periodic variability (rotation and occultation)Narrow emission lines (confinement)f/i
ratios quantify locationSlide65
What about other magnetic massive stars? Slide66
q1 Ori C has a hard X-ray spectrum with narrow linesSlide67
q1 Ori C has a hard X-ray spectrum with narrow lines
…HD191612 and z Ori have soft X-ray spectra with broad linesFe XVII in z
Ori
-
v
inf
+
v
inf
l
oSlide68
1
Ori C
z
OriSlide69
t Sco does have a hard spectrum and narrow lines
Ne
Lya
compared to instrumental response: narrowSlide70
t Sco: closed loop region is near
the star…Slide71
t Sco: closed loop region is near the star……
f/i ratios tell us X-rays are far from the star (~3Rstar)
f
iSlide72
Do He-like f/i ratios provide evidence of hot plasma near the photospheres of O stars? Slide73
Do He-like f/i ratios provide evidence of hot plasma near the photospheres of O stars? No, I’m afraid they do
not. Slide74
z Pup S XV Chandra MEG
Features are very blended in most O stars: here, the three models are statistically indistinguishablelocations span 1.1 Rstar
to infinitySlide75
s Ori E (h* ~ 10
7: RRM+RFHD)Slide76
Chandra ACIS (low-resolution, CCD) spectrumSlide77
DEM derived from Chandra ACIS spectrumSlide78
DEM from RFHD modelingSlide79
Observed & theoretical DEMs agree wellSlide80Slide81
Conclusions
MCWS dynamical scenario explains q1
Ori
C well…but, location of hot plasma may be even closer to the star; UV absorption line phase dependence isn’t right.
Most other magnetic massive stars have X-ray emission that is different from
q
1
Ori
C
Some have soft X-ray spectra with broad lines
Closed field regions may not always be associated with the X-rays (
t
Sco
)
f/i
ratios, hard X-rays, variability in massive stars…
not
unique to magnetic field wind interaction