/
Effect of Nonadherence to Instructions For Use on Outcomes of Endovascular Treatment of Effect of Nonadherence to Instructions For Use on Outcomes of Endovascular Treatment of

Effect of Nonadherence to Instructions For Use on Outcomes of Endovascular Treatment of - PowerPoint Presentation

onionchevrolet
onionchevrolet . @onionchevrolet
Follow
343 views
Uploaded On 2020-07-01

Effect of Nonadherence to Instructions For Use on Outcomes of Endovascular Treatment of - PPT Presentation

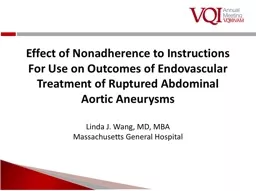
Linda J Wang MD MBA Massachusetts General Hospital None Disclosures Ruptured AAA rAAA EVAR Anatomic Constraints IFU Nonadherence IFU nonadherence rates 38 to 69 Assess rates of IFU nonadherence in ID: 791683

nifu ifu cifu compliant ifu nifu compliant cifu revar raaa evar patients outcomes methods nonadherence aaa complication perioperative matched

Share:

Link:

Embed:

Download Presentation from below link

Download The PPT/PDF document "Effect of Nonadherence to Instructions F..." is the property of its rightful owner. Permission is granted to download and print the materials on this web site for personal, non-commercial use only, and to display it on your personal computer provided you do not modify the materials and that you retain all copyright notices contained in the materials. By downloading content from our website, you accept the terms of this agreement.


Presentation Transcript

Slide1

Effect of Nonadherence to Instructions For Use on Outcomes of Endovascular Treatment of Ruptured Abdominal Aortic Aneurysms

Linda J. Wang, MD, MBA

Massachusetts General Hospital

Slide2

None

Disclosures

Slide3

Ruptured AAA (

rAAA

)

Slide4

EVAR Anatomic Constraints

Slide5

IFU Nonadherence

IFU non-adherence rates: 38% to 69%

Slide6

Assess rates of IFU nonadherence in

rAAA

patients treated with EVAR

Assess effect of IFU nonadherence on

rAAA

outcomesObjectives

Slide7

Review of all

rAAA

repairs in the VQI, 2003-2018

Neck-specific IFU violations assessed:

Diameter >28mm

Length <15mmAngulation >60

Cohorts:

Methods

rEVAR

IFU compliant (

cIFU

)

IFU non-compliant (

nIFU

)

Slide8

Review of all

rAAA

repairs in the VQI, 2003-2018

Neck-specific IFU violations assessed:

Diameter >28mm

Length <15mmAngulation >60

Cohorts:

Methods

rEVAR

IFU compliant (

cIFU

)

IFU non-compliant (

nIFU

)

VS

Slide9

Review of all

rAAA

repairs in the VQI, 2003-2018

Neck-specific IFU violations assessed:

Diameter >28mm

Length <15mmAngulation >60

Cohorts:

Methods

rEVAR

IFU compliant (

cIFU

)

IFU non-compliant (

nIFU

)

VS

rOSR

p-

rOSR

p-

nIFU

Propensity-matched

vs

Slide10

Primary outcomes:

Perioperative complications: CV, pulmonary, renal, bowel/limb ischemia, reoperation

30-day mortality

1-year mortality

Univariate analysis, Cox regression, Kaplan-Meier analysis

Methods

Slide11

rEVAR

:

cIFU

vs

nIFU


Demographics

cIFU

n=595

nIFU

n=317

p

Age, years

73

10

73

10

.47

Sex, female

105 (18%)

73 (23%)

.051

Caucasian race

520 (87%)

282 (89%)

.49

Comorbidities


Hypertension

448 (75%)

241 (77%)

.66

CHF

83 (14%)

40 (13%)

.60

Smoking history

452 (77%)

245 (77%)

.78

COPD

156 (26%)

82 (26%)

.97

Diabetes

107 (18%)

50 (16%)

.40

Max AAA

dia

, mm*

70 (58,85)

76 (61,90)

.002

* median (IQR)

Slide12

rEVAR

:

cIFU

vs

nIFU


Demographics

cIFU

n=595

nIFU

n=317

p

Age, years

73

10

73

10

.47

Sex, female

105 (18%)

73 (23%)

.051

Caucasian race

520 (87%)

282 (89%)

.49

Comorbidities


Hypertension

448 (75%)

241 (77%)

.66

CHF

83 (14%)

40 (13%)

.60

Smoking history

452 (77%)

245 (77%)

.78

COPD

156 (26%)

82 (26%)

.97

Diabetes

107 (18%)

50 (16%)

.40

Max AAA

dia

, mm*

70 (58,85)

76 (61,90)

.002

* median (IQR)

Slide13

rEVAR

:

cIFU

vs

nIFU


Perioperative Outcomes

cIFU

n=595

nIFU

n=317

p

MI

34 (6%)

30 (10%)

.03

Respiratory complication

74 (13%)

69 (22%)

<.001

Stroke

13 (2%)

9 (3%)

.54

Death

45 (14%)

42 (22%)

.01

Major complication, any

158 (27%)

107 (34%)

.03

Slide14

rEVAR

: 1-Year Survival

p=.06

Slide15

P-matched:

nIFU

EVAR vs OSR


Demographics

nIFU

n=172

OSR

n=172

p

Age, years

74

9

74

9

1

Sex, female

40 (23%)

38 (22%)

.80

Caucasian race

156 (91%)

165 (96%)

.052

Comorbidities


Hypertension

134 (78%)

130 (77%)

.75

CHF

15 (9%)

15 (9%)

.96

Smoking history

136 (79%)

136 (79%)

1

COPD

42 (4%)

42 (24%)

1

Diabetes

25 (15%)

27 (16%)

.76

Max AAA

dia

, mm

74

22

75

20

.87

Slide16

P-matched:

nIFU

EVAR vs OSR


Perioperative Outcomes

nIFU

n=172

OSR

n=172

p

MI

16 (9%)

29 (18%)

.02

Respiratory complication

35 (21%)

70 (44%)

<.001

Stroke

4 (2%)

2 (4%)

.54

Death

37 (22%)

55 (32%)

.03

Major complication, any

57 (33%)

110 (68%)

<.001

Slide17

P-matched: 1-Year Survival

p=.08

Slide18

Predictors 30-day Mortality

Slide19

>1/3

rAAA

EVAR patients fall outside of IFU guidelines

Among EVAR, non-compliant IFU patients have worse outcomes than compliant IFU patients

After matching, non-compliant IFU EVAR patients have better perioperative morbidity than patients undergoing open repair

Conclusion

Slide20

Questions?

Thank you