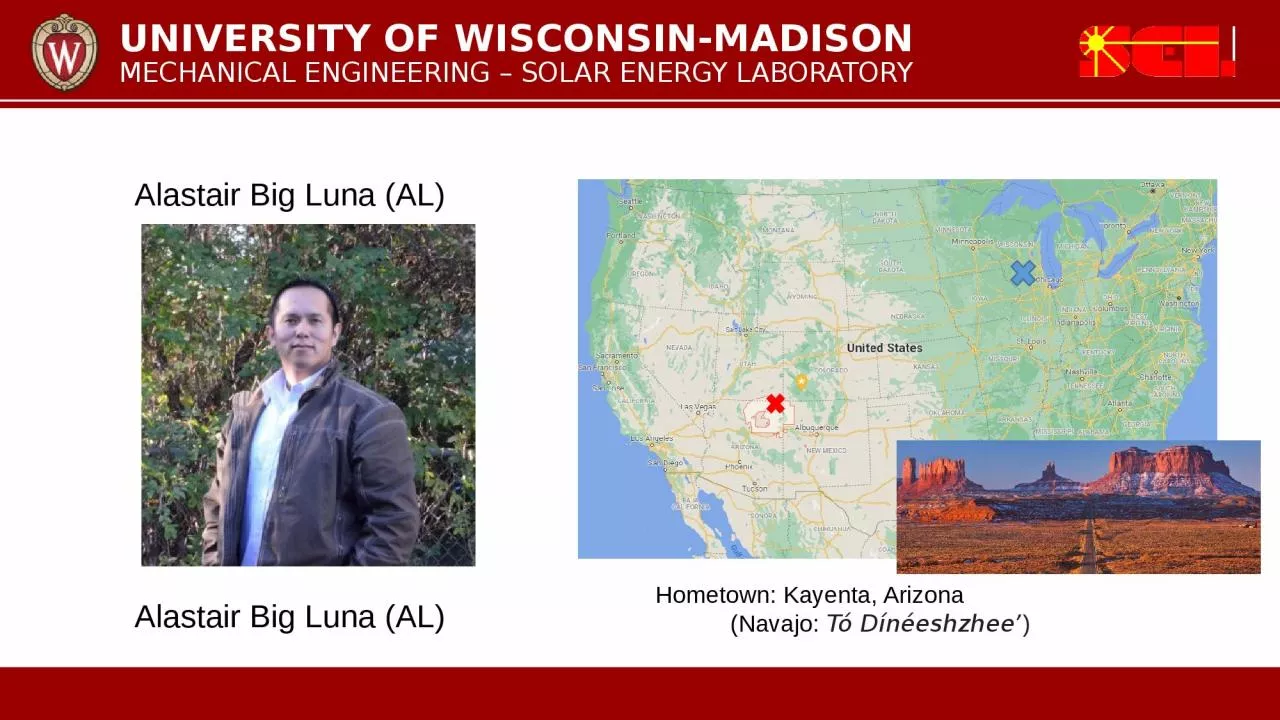
/
Hometown: Kayenta, Arizona Hometown: Kayenta, Arizona

Hometown: Kayenta, Arizona - PowerPoint Presentation

pagi
pagi . @pagi
Follow
64 views
Uploaded On 2024-01-29

Hometown: Kayenta, Arizona - PPT Presentation

Navajo Tó Dínéeshzheeʼ Alastair Big Luna AL Alastair Big Luna AL Optical Fiber Temperature and Stress Measurements Section 1 Discussion on how optical fibers work Discussion on Rayleigh backscatter ID: 1042934

fiber optical frequency strain optical fiber strain frequency high temperature rayleigh distributed domain reflectometry spatial resolution applied vol scatter

Share:

Link:

Embed:

Download Presentation from below link

Download Presentation The PPT/PDF document "Hometown: Kayenta, Arizona" is the property of its rightful owner. Permission is granted to download and print the materials on this web site for personal, non-commercial use only, and to display it on your personal computer provided you do not modify the materials and that you retain all copyright notices contained in the materials. By downloading content from our website, you accept the terms of this agreement.


Presentation Transcript

1. Hometown: Kayenta, Arizona (Navajo: Tó Dínéeshzheeʼ)Alastair Big Luna (AL)Alastair Big Luna (AL)

2. Optical Fiber Temperature and Stress Measurements

3. Section 1Discussion on how optical fibers workDiscussion on Rayleigh backscatterDiscussion on OFDRDiscussion on the temperature and strain algorithmSection 2Characteristics of the LUNA ODiSI-B and temperature dataResearch on using strain data on pressurized vessels to characterize internal pressurePresentation Outline

4. Section 1: BackgroundOptic fibers, Rayleigh scattering, OFDR, Temperature & Strain Algothrim

5. Optical fibers may be used for temperature, strain, pressure.The spatial resolution is very high. Choice of having 1.25 [mm] at 24 [Hz] or 5 [mm] at 100 [Hz] of spacing between each data point.For example, in a one-meter sensor, you can have as much 800 points of data for each time step. At 24 [Hz], you have 19,200 points of data for each second. For this reason, fiber optic sensors are candidates for research, big data collection for machine learning algorithms, and health monitoring of critical components in power plants or facilities.Why use fiber optic sensorsFigure: Fiber-optic temperature and strain sensor – 1 [m] length

6. Required components for temperature and strain measurementsSingle mode fibersTunable laser and reflectometerTemperature and Strain algorithm

7. Snell’s lawThe critical angle The bigger the difference between the indices of refraction in the two optical materials, the larger the critical angle.The fiber is design to be a light guide. Optical Fiber Theory – Total Internal ReflectionFigure: Illustration of Total Internal Reflection [1][1] https://images.fineartamerica.com/images-medium-large-5/refraction-and-total-internal-reflection-russell-kightley.jpg

8. Outside Vapor Deposition (OVD) process is commonly used in the manufacturing of optical fibers. 3 steps: Laydown, consolidation, and draw.Laydown process - a soot preform is made from ultra pure vapors as they react in the flame to form fine soot particles of silica or Germania. Consolidation process – the bait rod is removed and the preform is placed in a furnace. The preform is sintered into a solid glass. Draw process – the preform is placed in a draw tower and drawn into one continuous strand of silica fiber. Silica Optical Fiber – Manufacturing processFigure: Illustration of Laydown process [2][2] P. Aithal and H. Ravindra, Textbook of Engineering Physics, 1st ed. Acme Learning Private Limited, 2021.

9. First proposed for measuring losses inside single-mode optical fiber system. [3]Relies on a scan of the Rayleigh backscatter amplitude.A frequency scan is made by changing the wavelength of the laser and a detector measures the backscatter amplitudeOptical Frequency Domain Reflectometry Figure 5: Fiber-optic temperature and strain sensor[3]W. Eickhoff and R. Ulrich, "Optical frequency domain reflectometry in single‐mode fiber", Applied Physics Letters, vol. 39, no. 9, pp. 693-695, 1981. Available: 10.1063/1.92872

10. First proposed for measuring losses inside single-mode optical fiber system. [3]Relies on a scan of the Rayleigh backscatter amplitude.A frequency scan is made by changing the wavelength of the laser and a detector measures the backscatter amplitudeOptical Frequency Domain Reflectometry Figure 5: Fiber-optic temperature and strain sensor[3]W. Eickhoff and R. Ulrich, "Optical frequency domain reflectometry in single‐mode fiber", Applied Physics Letters, vol. 39, no. 9, pp. 693-695, 1981. Available: 10.1063/1.92872

11. Optical Frequency Domain Reflectometry (OFDR)-Algorithm[2]M. Froggatt and J. Moore, "High-spatial-resolution distributed strain measurement in optical fiber with Rayleigh scatter", Applied Optics, vol. 37, no. 10, p. 1735, 1998. Available: 10.1364/ao.37.001735 [Accessed 30 July 2020].Iω

12. Optical Frequency Domain Reflectometry (OFDR)-Algorithm[2]M. Froggatt and J. Moore, "High-spatial-resolution distributed strain measurement in optical fiber with Rayleigh scatter", Applied Optics, vol. 37, no. 10, p. 1735, 1998. Available: 10.1364/ao.37.001735 [Accessed 30 July 2020].FFTIωXIxm

13. Optical Frequency Domain Reflectometry (OFDR)-Algorithm[2]M. Froggatt and J. Moore, "High-spatial-resolution distributed strain measurement in optical fiber with Rayleigh scatter", Applied Optics, vol. 37, no. 10, p. 1735, 1998. Available: 10.1364/ao.37.001735 [Accessed 30 July 2020].FFTIωXIGage lengthxm

14. Optical Frequency Domain Reflectometry (OFDR)-Algorithm[2]M. Froggatt and J. Moore, "High-spatial-resolution distributed strain measurement in optical fiber with Rayleigh scatter", Applied Optics, vol. 37, no. 10, p. 1735, 1998. Available: 10.1364/ao.37.001735 [Accessed 30 July 2020].FFTIωFFTXIGage lengthReferenceωIxm

15. Optical Frequency Domain Reflectometry (OFDR)-Algorithm[2]M. Froggatt and J. Moore, "High-spatial-resolution distributed strain measurement in optical fiber with Rayleigh scatter", Applied Optics, vol. 37, no. 10, p. 1735, 1998. Available: 10.1364/ao.37.001735 [Accessed 30 July 2020].FFTIωFFTXIGage lengthReferenceSampleωωIIxm

16. Optical Frequency Domain Reflectometry (OFDR)-Algorithm[2]M. Froggatt and J. Moore, "High-spatial-resolution distributed strain measurement in optical fiber with Rayleigh scatter", Applied Optics, vol. 37, no. 10, p. 1735, 1998. Available: 10.1364/ao.37.001735 [Accessed 30 July 2020].FFTIωFFTXIGage lengthReferenceSampleCross CorrelatedωωIIΔωΔωmxmI

17. Optical Frequency Domain Reflectometry (OFDR)-Algorithm[2]M. Froggatt and J. Moore, "High-spatial-resolution distributed strain measurement in optical fiber with Rayleigh scatter", Applied Optics, vol. 37, no. 10, p. 1735, 1998. Available: 10.1364/ao.37.001735 [Accessed 30 July 2020].FFTIωFFTXIGage lengthReferenceSampleCross CorrelatedPeak Correlated to a specific locationωωIIΔωΔωmxmxmΔωmXΔωI

18. Optical Frequency Domain Reflectometry (OFDR)-Algorithm[2]M. Froggatt and J. Moore, "High-spatial-resolution distributed strain measurement in optical fiber with Rayleigh scatter", Applied Optics, vol. 37, no. 10, p. 1735, 1998. Available: 10.1364/ao.37.001735 [Accessed 30 July 2020].FFTIωFFTXIGage lengthReferenceSampleCross CorrelatedPeak Correlated to a specific locationωωIIΔωΔωmxmxmΔωmXΔωI

19. Optical Frequency Domain Reflectometry (OFDR)-Algorithm[2]M. Froggatt and J. Moore, "High-spatial-resolution distributed strain measurement in optical fiber with Rayleigh scatter", Applied Optics, vol. 37, no. 10, p. 1735, 1998. Available: 10.1364/ao.37.001735 [Accessed 30 July 2020].FFTIωFFTXIGage lengthReferenceSampleCross CorrelatedPeak Correlated to a specific locationωωIIΔωΔωmxmxmΔωmXΔωI

20. Optical Frequency Domain Reflectometry (OFDR)-Algorithm[2]M. Froggatt and J. Moore, "High-spatial-resolution distributed strain measurement in optical fiber with Rayleigh scatter", Applied Optics, vol. 37, no. 10, p. 1735, 1998. Available: 10.1364/ao.37.001735 [Accessed 30 July 2020].FFTIωFFTXIGage lengthReferenceSampleCross CorrelatedPeak Correlated to a specific locationωωIIΔωΔωmxmxmΔωmXΔωI

21. Optical Frequency Domain Reflectometry (OFDR)-Algorithm[2]M. Froggatt and J. Moore, "High-spatial-resolution distributed strain measurement in optical fiber with Rayleigh scatter", Applied Optics, vol. 37, no. 10, p. 1735, 1998. Available: 10.1364/ao.37.001735 [Accessed 30 July 2020].FFTIωFFTXIGage lengthReferenceSampleCross CorrelatedPeak Correlated to a specific locationωωIIΔωΔωmxmxmΔωmXΔωI

22. Optical Frequency Domain Reflectometry (OFDR)-Algorithm[2]M. Froggatt and J. Moore, "High-spatial-resolution distributed strain measurement in optical fiber with Rayleigh scatter", Applied Optics, vol. 37, no. 10, p. 1735, 1998. Available: 10.1364/ao.37.001735 [Accessed 30 July 2020].FFTIωFFTXIGage lengthReferenceSampleCross CorrelatedPeak Correlated to a specific locationωωIIΔωΔωmxmxmΔωmXΔωI

23. Section 2Distributed Temperature SensingLUNA ODiSI-B and ODiSI-6000

24. Furnace SetupTemperature fiber sensors

25. High Temperature Characteristics of the LUNA ODiSI-B and SMF

26. High Temperature Characteristics of the LUNA ODiSI-B and SMF

27. SMF modifications to withstand High Temperature EnvironmentsTest Parameters750 [C] - HE750 [C] - BNInterrogator SystemLuna ODiSI-BLuna ODiSI-BType of Optical FiberSingle mode (SMF-28e)Single mode (SMF-28e)Heater TypeTube FurnaceTube FurnaceAnneal Type800 [C] for 2 [hrs]800 [C] for 2 [hrs]Typical Experimental TimeframesUntil failureUntil failureTermination End Types~30 degree polish~30 degree polishBackfilled Gas TypeHeliumAir with Boron Nitride coatingOptical Fiber CoatingMechanically RemovedMechanically Removed

28. Optical fiber temperature sensors survivability test in 750 [C] furnacePlot shows the signal loss for the initial keys of Helium fiber (magenta) and BN fiber (blue). Red line shows 50% signal loss threshold. Helium and BN exceeded the 50% line at 18.6 [hr] and 42.4 [hr], respectively.Corning SMF-28 Ultra can survive 750 [C] temperatures for 1780 hours (10.6 weeks) when protected with Helium gas cover or Boron Nitride coatingIf we consider a 50% signal threshold for both He and BN fibers as a metric, then this test shows BN helps the fiber maintain signal more than the Helium backfilled gas by about 24 hours. 31 reference keys were made for both the Helium fiber and BN fiber. Creating numerous reference keys is not ideal to maintain signal, and therefore, we are searching for fibers that have enhanced Rayleigh scatter signals.18.6 [hrs] – He 42.4 [hrs] – BN

29. UW-Madison’s high pressure testing loop can simulate PWR conditions using single or multiple heating rods. PWR conditions can reach temperatures up to 400 [C] and pressures up to 25 [MPa]. Fiber optic sensor (FOS) system used to capture distributed temperature measurements with spatial resolution ranging from 1.25 [mm] to 5 [mm]. Critical Heat Flux (CHF) events detected, and trigger shut down of experiment to protect heat rod and testing facility.Health Monitoring via Distributed Temperature MeasurementsFigure: (a) High pressure testing loop. (b) Experimental temperature profile [C] mapped on Position [m] vs Time [s] plot. White spots represent no data. (c) Temperature [C] vs Position plot [m] of CHF event.

30. Distributed Strain SensingLUNA ODiSI-B

31. Conduct research on embedding fiber optical sensors (FOS) onto the surface of tubes for monitoring internal pressure.FOS are wrapped and bonded around tubes in a helical orientation or in a helical trench. The helical configuration allows for the optical strain sensor to be decomposed into its axial and circumferential components.Develop a methodology for collecting strain data in high-temperature and high-pressure environments. The strain data needs to be compensated for temperature influence.Health Monitoring via Distributed Strain MeasurementsFigure: Schematic of helical trench on a 3/8 [in] O.D. tube w/ 22.5 [in] length.

32. Experimental Setup and Correlation Methodology for the ODiSI-B A single-mode fiber from Corning (SMF 28-Ultra) was wrapped in the helix groove and adhered with Ceramabond 668, a high-temperature ceramic adhesive.Luna ODiSI-B was used to interrogate the SMF 28-Ultra fiber.A hydraulic pump was used to pressurize the 3/8-inch SS tube up to 10,000± 100 [psi]. Frequency shift response to 1,000± 100 [psi] stages in internal pressure up to 10,000± 100 [psi] were measured. Figure: Experimental setup (top). Frequency shift response to ten 1000± 100 [psi] stages(bottom).

33. Luna ODiSI-B Correlation for Hoop StrainInternal pressure was converted to hoop strain using pressurized vessel equations.Hoop strain was plotted against frequency shift.MS Excel was used to find a linear fit for a correlation.New correlation is ε=-59.60υ where υ is the frequency shift values. Figure: Hoop strain plotted against Frequency shift [dB]. MS Excel was used to find a linear fit.

34. Thank you