/
MonthTrinityJF Carr MonthTrinityJF Carr

MonthTrinityJF Carr - PDF document

paige
paige . @paige
Follow
342 views
Uploaded On 2021-09-15

MonthTrinityJF Carr - PPT Presentation

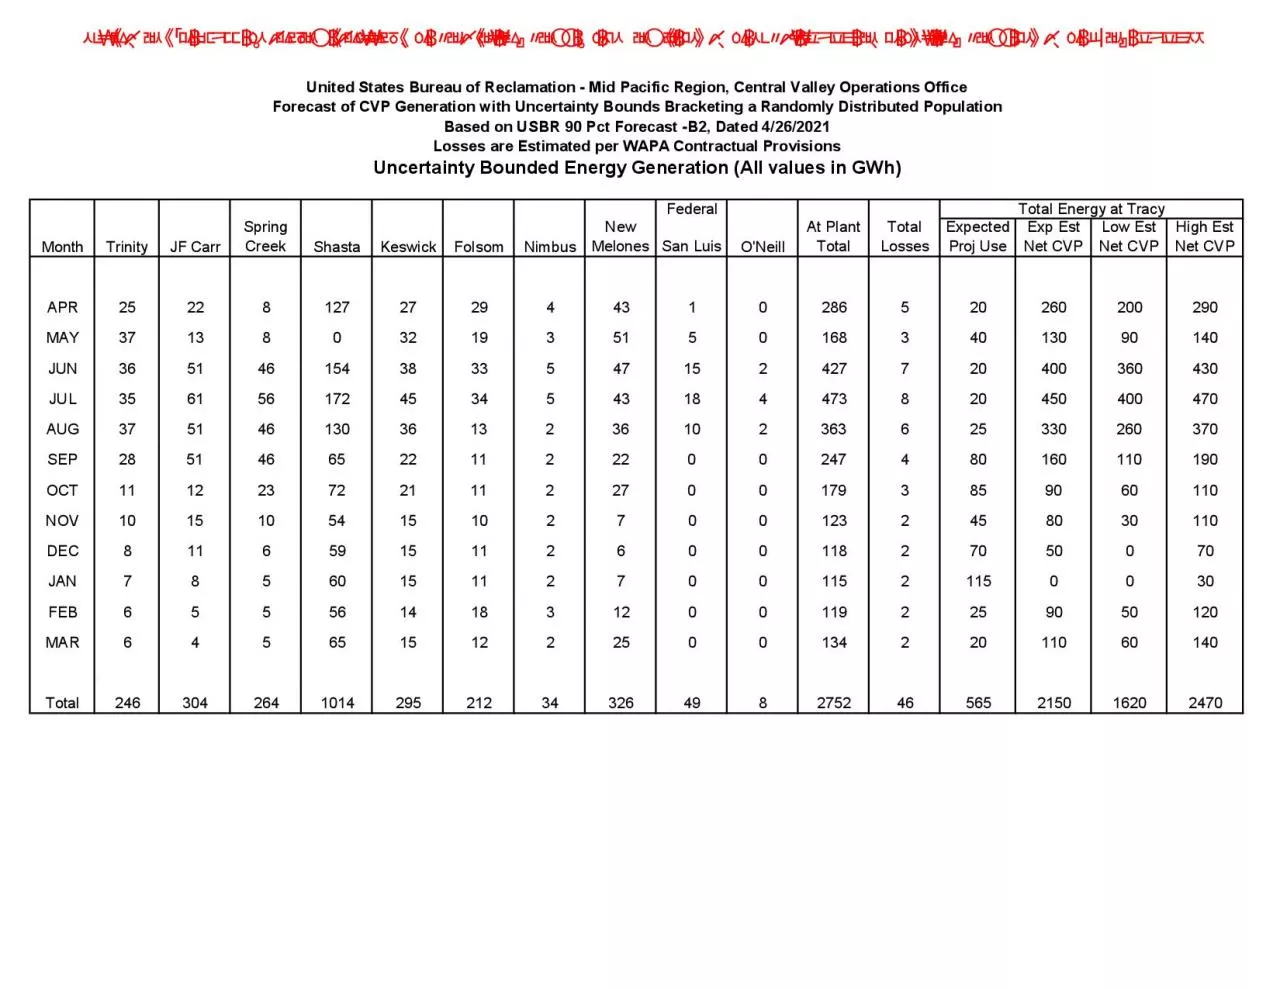
FederalSpring CreekShastaKeswickFolsomNimbusNew Melones San LuisONeillAt Plant TotalTotal LossesExpected Proj UseLow Est Net CVPHigh Est Net CVP18181818181818151010MAYDECTotal Energy at Tracy ID: 881489

total cvp tracy forecast cvp total forecast tracy federal generation san based losses net expected dated values pacific region

Share:

Link:

Embed:

Download Presentation from below link

Download Pdf The PPT/PDF document "MonthTrinityJF Carr" is the property of its rightful owner. Permission is granted to download and print the materials on this web site for personal, non-commercial use only, and to display it on your personal computer provided you do not modify the materials and that you retain all copyright notices contained in the materials. By downloading content from our website, you accept the terms of this agreement.


Presentation Transcript

1 Federal MonthTrinityJF Carr Spring Creek
Federal MonthTrinityJF Carr Spring Creek ShastaKeswickFolsomNimbus New Melones San Luis O'Neill At Plant Total Total Losses Expected Proj Use Low Est Net CVP High Est Net CVP 1.8%1.8%1.8%1.8%1.8%1.8%1.8%1.5%1.0%1.0%MAY DEC Total Energy at Tracy United States Bureau of Reclamation - Mid Pacific Region, Central Valley Operations Office Based on USBR 90 Pct Forecast -B2, Dated 4/26/2021 Losses are Estimated per WAPA Contractual Provisions Uncertainty Bounded Energy Generation (All values in GWh) Federal MonthTrinityJF Carr Spring Creek ShastaKeswickFolsomNimbus New Melones San Luis O'Neill At Plant Total Total Losses Expected CVP Schd. Out Expected Proj Use Expected Net CVP 1.8%1.8%1.8%1.

2 8%1.8%1.8%1.8%1.5%1.0%1.0%MAYJUNJULAUGOC
8%1.8%1.8%1.8%1.5%1.0%1.0%MAYJUNJULAUGOCTNOV DECJANFEBMAR Forecast of CVP Generation Based on USBR 90 Pct Forecast -B2, Dated 4/26/2021 Losses are Estimated per WAPA Contractual Provisions Expected Capacity Based on Estimated Gross Head (All values in MW) Total Capacity at Tracy United States Bureau of Reclamation - Mid Pacific Region, Central Valley Operations Office Federal Tracy Federal Banks Contra Costa O'Neill San Luis San Felipe Dos Amigos Other Uses Exp CVP Expected On Peak Expected Off Peak 1.8%1.8%1.8%1.8%1.8%1.8%1.8%1.5% 1022010102780213412520187565235330 FEB MAR Total DEC JAN Month APR MAY JUN JUL AUG SEP OCT NOV Total at Tracy United States Bureau of Reclamation - Mid Pacific Regio

3 n, Central Valley Operations Office Fore
n, Central Valley Operations Office Forecast of CVP Generation Based on USBR 90 Pct Forecast -B2, Dated 4/26/2021 Project Use Pumping Expected Project Energy Use at Tracy Load Center (All values in GWh) Other On Off On Off On Off On Off On Off On Off On Off On/Off 1.8%1.8%1.8%1.8%1.8%1.8%1.8%1.5%1.0% 31212092226656666003316160137110011181800334402311004181800224402322663 DEC JAN FEB MAR OCT NOV JUN JUL AUG SEP APR MAY Month United States Bureau of Reclamation - Mid Pacific Region, Central Valley Operations Office Forecast of CVP Generation Based on USBR 90 Pct Forecast -B2, Dated 4/26/2021 Project Use Pumping Expected Project Capacity Use at Tracy Load Center (All values in MW) San Felipe Dos Amigos Tracy

4 Federal Banks Contra Costa O'Neill Fede
Federal Banks Contra Costa O'Neill Federal San Luis Spring New Federal Total Month Trinity JF Carr Creek Shasta Keswick Folsom Nimbus Melones San Luis O'Neill Losses CVP Proj Use Net CVP 1.8%1.8%1.8%1.8%1.8%1.8%1.8%1.5%1.0%1.0%MAYJUNJULAUGOCTNOVDEC JANFEBMARTotal Energy Generation (All values in GWh) Total at Tracy United States Bureau of Reclamation - Mid Pacific Region, Central Valley Operations Office Forecast of CVP Generation Based on USBR 90 Pct Forecast -B2, Dated 4/26/2021 Losses are Estimated per WAPA Contractual Provisions Spring New Federal Tot. Cap. Total Month Trinity JF Carr Creek Shasta Keswick Folsom Nimbus Melones San Luis O'Neill at Plant Losses CVP Sch. Out PU Net CVP 1.8%1.8%1.8%1.8

5 %1.8%1.8%1.8%1.5%1.0%1.0%MAYJUNJULAUGOCT
%1.8%1.8%1.8%1.5%1.0%1.0%MAYJUNJULAUGOCTNOV DECJANFEBMAR Capacity Based on Estimated Gross Head (All values in MW) Total Capacity at Tracy United States Bureau of Reclamation - Mid Pacific Region, Central Valley Operations Office Forecast of CVP Generation Based on USBR 90 Pct Forecast -B2, Dated 4/26/2021 Losses are Estimated per WAPA Contractual Provisions Federal Contra Federal San Dos Other Tracy Banks Costa O'Neill San Luis Felipe Amigos Uses CVP On Peak Off Peak 1.8%1.8%1.8%1.8%1.8%1.8%1.8%1.5% 1022010102780213412520187565235330 MAR Total SEP OCT NOV DEC JAN FEB JUL APR MAY JUN Month Project Energy Use at Tracy Load Center (All values in GWh) Total at Tracy AUG United States Bureau of Reclamation -

6 Mid Pacific Region, Central Valley Opera
Mid Pacific Region, Central Valley Operations Office Forecast of CVP Generation Based on USBR 90 Pct Forecast -B2, Dated 4/26/2021 Project Use Pumping Other On Off On Off On Off On Off On Off On Off On Off On/Off 1.8%1.8%1.8%1.8%1.8%1.8%1.8%1.5%1.0% 31212092226656666003316160137110011181800334402311004 18 18 0 0 2 2 4 4 0 23 2 2 6 6 3 FEB MAR SEP OCT NOV DEC JAN APR MAY JUN JUL AUG Tracy Month United States Bureau of Reclamation - Mid Pacific Region, Central Valley Operations Office Forecast of CVP Generation Dos Amigos Based on USBR 90 Pct Forecast -B2, Dated 4/26/2021 Project Use Pumping Project Capacity Use at Tracy Load Center (All values in MW) San Felipe Federal Banks Contra Costa O'Neill Federal Sa

7 n Luis Federal MonthTrinityJF Carr Sprin
n Luis Federal MonthTrinityJF Carr Spring Creek ShastaKeswickFolsomNimbus New Melones an Luis O'Neill At Plant Total Total Losses Expected Proj Use Exp Est Net CVP Low Est Net CVP High Est Net CVP 1.8%1.8%1.8%1.8%1.8%1.8%1.8%1.5%1.0%1.0%MAYJUNJULAUGOCTNOV DECJANFEBMARTotal Total Energy at Tracy United States Bureau of Reclamation - Mid Pacific Region, Central Valley Operations Office Forecast of CVP Generation with Uncertainty Bounds Bracketing a Randomly Distributed Population Based on USBR 90 Pct Forecast -B2, Dated 4/26/2021 Losses are Estimated per WAPA Contractual Provisions Uncertainty Bounded Energy Generation (All values in GWh) Federal MonthTrinityJF Carr Spring Creek ShastaKeswickFolsomNimbus Ne

8 w Melones San Luis O'Neill At Plant Tota
w Melones San Luis O'Neill At Plant Total Total Losses Expected Proj Use Exp Est Net CVP Low Est Net CVP High Est Net CVP 1.8%1.8%1.8%1.8%1.8%1.8%1.8%1.5%1.0%1.0%MAYJUNJULAUGOCTNOV DECJANFEBMARTotal Total Energy at Tracy United States Bureau of Reclamation - Mid Pacific Region, Central Valley Operations Office Forecast of CVP Generation with Uncertainty Bounds Bracketing a Randomly Distributed Population Based on USBR 90 Pct Forecast -B2, Dated 4/26/2021 Losses are Estimated per WAPA Contractual Provisions Uncertainty Bounded Energy Generation (All values in GWh) IRUHFDVW6KDVWDGXULQJ$SULODQGIXOO