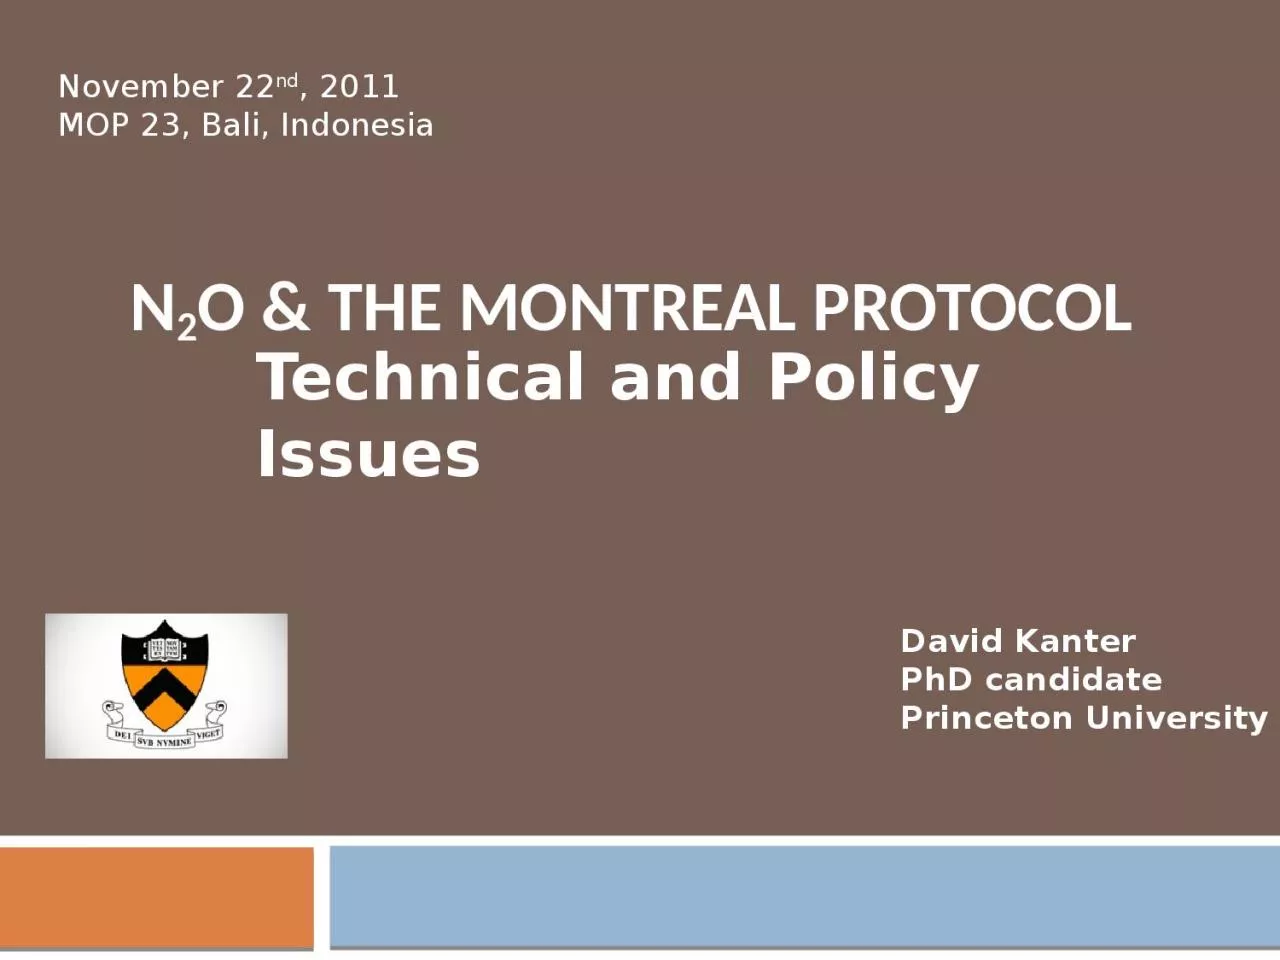
/
N 2 O & the Montreal Protocol N 2 O & the Montreal Protocol

N 2 O & the Montreal Protocol - PowerPoint Presentation

paige
paige . @paige
Follow
65 views
Uploaded On 2023-11-15

N 2 O & the Montreal Protocol - PPT Presentation

Technical and Policy Issues David Kanter PhD candidate Princeton University November 22 nd 2011 MOP 23 Bali Indonesia Outline Breakdown of N 2 O emissions sources Point vs nonpoint sources ID: 1031953

emissions n2o reductions 2009 n2o emissions 2009 reductions amp reduction acid reduce fertilizer agricultural technologies environmental agriculture 2011 climate

Share:

Link:

Embed:

Download Presentation from below link

Download Presentation The PPT/PDF document "N 2 O & the Montreal Protocol" is the property of its rightful owner. Permission is granted to download and print the materials on this web site for personal, non-commercial use only, and to display it on your personal computer provided you do not modify the materials and that you retain all copyright notices contained in the materials. By downloading content from our website, you accept the terms of this agreement.


Presentation Transcript

1. N2O & the Montreal ProtocolTechnical and Policy IssuesDavid KanterPhD candidate Princeton UniversityNovember 22nd, 2011MOP 23, Bali, Indonesia

2. OutlineBreakdown of N2O emissions sourcesPoint vs. non-point sourcesGlobal N2O emission trendsWhy should Montreal Protocol (MP) take on N2O?How can emissions be reduced?Industry & stationary/mobile combustionAgricultureBehavioral changesTechnological opportunitiesHow can targets be developed and implemented?Existing policiesAssessment Panels and the Multilateral Fund (MLF) Conclusions & Next Steps

3. N2O emissions breakdownPrinceton University (2011) “Complements to Carbon” Point sources:Industry (from nitric acid and adipic acid production)Stationary combustion (e.g. coal power plants)Wastewater treatment facilities Non-point sources:Agriculture (synthetic fertilizer, manure, legumes…)Mobile combustion (transport)Biomass burning

4. Global N2O Emission Trends(USEPA, 2011)

5. Why should MP take on N2O?N2O now most abundant ODS in atmosphere, with emissions projected to increase (Ravishankara et al. 2009)Current international tools for controlling N2O are weakLittle attention to N2O within Kyoto Protocol – CDM has focused solely on industrial N2O emissionsIncreasing calls to regulate non-CO2 climate forcers in non-UNFCCC forums (Molina et al. 2009; HFC Amendments 2009-2011)MP well-suited for N2ORising N2O emissions threaten MP’s continued successEffective, well-respected assessment panelsSuccessful financial mechanism (MLF)Binding (common and differentiated) commitments of all Parties

6. Why are N2O reduction opportunities different?Much more publicly available information on N2O reduction strategiesIndustry associations acknowledge both environmental impacts of N2O and effectiveness of reduction strategies (e.g. International Fertilizer Industry Association (IFA) says N2O emissions can be reduced by 25% using existing practices and technologies – IFA, 2009)Leading companies already developing and marketing abatement technologies (e.g. Yara International), in addition to publicizing best practices.N2O reductions have more environmental co-benefits (ozone, climate, air, water)

7. How emissions can be reduced: Industry et al.Nitric and adipic acid manufacturingNitric acid: Catalytic reduction techniques, which reduce both N2O and NOx emissions by over 90% (SEI 2010). 20% of US plants have N2O abatement technology installed (USEPA, 2006) Adipic acid: Catalytic decomposition and thermal destruction techniques, which reduce N2O emissions by approx. 95% (USEPA 2011). 90% of US plants have N2O abatement technology installed (USEPA, 2006)TransportNext generation catalytic converters – reduce N2O and NOx emissions (EPA/DoT regulations)Stationary combustionImproved combustion technologies (e.g. pressurized fluidized bed combustion) and catalytic reduction techniques (CARB)

8. How emissions can be reduced: AgricultureBehavioral practicesFertilizer best management practices (Robertson & Vitousek 2009):Watershed management Crop residue recyclingPrecision & split fertilizer application Legume cultivation/cover cropManure management4Rs: Right product, right rate, right time, right place (IFA)

9. How emissions can be reduced: Agriculture (Cont.)Technological solutions:Nitrification inhibitorsAdditives to traditional fertilizers that delay production of nitrate (NO3)Reduce N2O emissions by approx. 40% (Akiyama et al. 2009).Used on 10% of US maize cropland (Mosier et al., 2004)Controlled-release fertilizers Coating or chemical modification of fertilizer, which slows the rate of nutrient release. Reduce N2O emissions by approx. 35% (Akiyama et al., 2009) Used on <1% of US cropland due to cost (Mosier et al. 2004)Other – Breeding and genetic engineering of crops to increase N use efficiency

10. How can reductions be implemented?Industrial emission reductions:Easiest to implement and could be addressed before agriculture. Technological solutions available for all facilities (of which there are a limited number).Agricultural N2O emissions: Begin with most cost effective reductions. N fertilizer is essential to crop production, but ~50% lost to the environment. Improvements would reduce costs and N pollution.Goal is to use existing N fertilizers more efficiently, as well as encourage adoption of new fertilizer technologies.Due to tight coupling of N cycle, care should be taken not to exacerbate other forms of N pollution while reducing N2O (Galloway et al., 2003).

11. Existing N PoliciesN2O:EU Emissions Trading Scheme (ETS) – Credit for N2O emissions reductions from nitric acid plants will be issued starting in 2013.Alberta (Canada) Quantification Protocol for Agricultural N2O Emissions Reductions – Issues credits for on-farm reductions of N2O emissions and fuel use associated with management of fertilizer, manure and crop residues. Kyoto Protocol - Handful of CDM projects to reduce industrial N2O emissions.US EPA/Dept. of Transportation – Cap on tailpipe N2O emissions of 0.010g per mile.UK Climate Change Act– N2O covered under a general GHG reduction targetAustralia Carbon Tax – N2O to be coveredReactive N (indirect impact on N2O):EU -Nitrates DirectiveUSA - Safe Drinking Water Act, Clean Water Act, Clean Air ActInternational - Convention on Long Range Transport of Air Pollution

12. Assessment Panels and MLFAssessment panels:Logical next step given N2O’s threat to ozone layer would be to create new sub-panel within Technology and Economics Assessment Panel(Environmental Effects Panel & Scientific Assessment Panel already cover N2O – see SAP, 2010). Experts exist on both environmental impacts of N2O and technical solutions across the globe in both the public and private sector.Multilateral Fund (MLF):Clear incremental costs and available technologies for industrial emissions abatementSimilar strategy to methyl bromide for agricultural N2O emissions would be suitable - a mix of technology transfer and training, technical assistance and information dissemination projects.

13. Conclusions and next stepsConclusions:N2O’s ozone depleting properties, weak international controls, as well as MP’s institutional structure all favor inclusion of N2O in the MP.Significant N2O emission reductions are possible across most sectorsEmissions reductions are already being implemented by a suite of policies, which should be harnessed by MP, but global controls necessaryNext steps:TEAP (or TEAP-like) report (and/or a Special Report in conjunction with the IPCC) on N2O reduction opportunities.Industry workshop (under TEAP auspices) on N2O reduction opportunities.

14. ReferencesAkiyama et al. (2010) “Evaluation of effectiveness of enhanced-efficiency fertilizers as mitigation options for N2O and NO emissions from agricultural soils: meta-analysis”, Global Change Biology, 16:1837-1846California Air Resources Board “Options for N2O emission reductions related to stationary combustion” (B.2.2)Galloway et al. (2003) “The nitrogen cascade”, Bioscience, 53, 341-356 IFA (2009) “Fertilizers, climate change, and enhanced agricultural productivity sustainably”Molina et al. (2009) “Reducing abrupt climate change risk using the Montreal Protocol and other regulatory actions to complement cuts in CO2 emissions”, PNASMosier et al. (2004) “Agriculture and the Nitrogen Cycle” (SCOPE)SEI (2010) “Industrial N2O projects under the CDM: The case of nitric acid production”, SEI Working Paper WP-US-1007Robertson G.P., Vitousek P. (2009) “Nitrogen in Agriculture: Balancing the Cost of an Essential Resource”, Annu. Rev. Environ. Resour., 34:97-125USEPA (2006) “Global mitigation of non-CO2 greenhouse gases”USEPA (2011) “DRAFT: Global Anthropogenic Non-CO2 Greenhouse Gas Emissions: 1990 – 2030”

15. Acknowledgements & QuestionsThanks to Ravishankara and Pete Grabiel for their support and participation. Thanks to Professors Denise Mauzerall, Bill Moomaw (Tufts), Bob Keohane & Michael Oppenheimer for their on-going intellectual support. Thanks to Siebel Energy Challenge, Princeton Institute for International & Regional Studies (PIIRS), and Princeton Science Technology, and Environmental Policy (STEP) program for funding this trip.Questions?