/
A New Stellar Stream? A New Stellar Stream?

A New Stellar Stream? - PowerPoint Presentation

pamella-moone
pamella-moone . @pamella-moone
Follow
369 views
Uploaded On 2017-11-04

A New Stellar Stream? - PPT Presentation

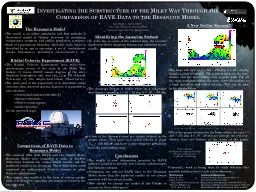
The large red eye at l 240 270 deg b 10 30 deg signals a point of interest The gradient between the overdensity and the surrounding area is quite high For all the stars contained within this area there are outliers at a high ID: 602560

model deg rave stars deg model stars rave results besan

Share:

Link:

Embed:

Download Presentation from below link

Download Presentation The PPT/PDF document "A New Stellar Stream?" is the property of its rightful owner. Permission is granted to download and print the materials on this web site for personal, non-commercial use only, and to display it on your personal computer provided you do not modify the materials and that you retain all copyright notices contained in the materials. By downloading content from our website, you accept the terms of this agreement.


Presentation Transcript

Slide1

A New Stellar Stream?The large red “eye” at l = 240 – 270 deg, b = 10 – 30 deg signals a point of interest. The gradient between the over-density and the surrounding area is quite high. For all the stars contained within this area, there are outliers at a high metallicty and radial velocity. This can be seen in the graphs below.When the proper motions for the stars within the area l = 240 – 270 deg, b = 10 – 30 deg are plotted, the red over-density stars are distinct at the center of the graph.Currently, work is being done to verify whether this possible substructure is truly a new discovery.

Investigating the Substructure of the Milky Way Through the Comparison of RAVE Data to the Besançon Model

Kate Hughes1, Andreas Ritter21University of Rochester, Rochester, NY2National Central University, Jhongli, Taiwan

Background Image: http://www.hudsonfla.com/1hst.htm

Acknowledgements

National Science Foundation's Office of International Science and Engineering award number 1065093, NCU, the Department of Physics and Astronomy at NCU, Dr. Shashi Kanbur, the International Office at NCU

The

Besançon

Model

The model is an online simulation tool that provides a theoretical model of Galaxy structure by predicting evolutionary scenarios and stellar population synthesis.Each of 4 populations (thin disc, thick disc, halo, bulge) is described by an age or age-range, a set of  evolutionary tracks, kinematics, metallicity characteristics, etc.RAdial Velocity Experiment (RAVE)The RAdial Velocity Experiment is a multi-fiber spectroscopic survey of the stars in the Milky Way Galaxy. It covers 20,000 square degrees of the sky’s Southern hemisphere and uses the 1.2-m UK Schmidt Telescope of the Anglo-Australian Observatory.The main goal of the experiment is to determine radial velocities from observed spectra; however, it is possible to also calculate: elemental abundances/metallicitydistance estimateseffective temperaturessurface gravities for the surveyed stars.Comparison of RAVE Data to Besançon ModelThe reduced data from RAVE and the results of the Besançon Model were compared in order to discover differences between the actual RAVE results and the predicted results from Besançon. These differences could represent an undiscovered Galactic stream or other Galactic substructure.The output was modeled in the form of various graphs with over-densities signaling discrepancies between the two data sets.

Identifying the Aquarius Stream

To verify the accuracy of the reduced data, the recently discovered (2010) Aquarius Stream was identified in our

results.

The Aquarius Stream is visible above as a red-orange over-density spanning l = 30 – 75 deg, b = -50 – -70 deg.A few of the Stream’s stars are clearly defined in the graphs above. They move at a radial velocity of about Vlos = -200 km s-1 and have a more negative metallicity than the surrounding stars.ConclusionsThe wealth of new information provided by RAVE makes it possible to identify new Galactic substructures like Galactic streams.Comparing the reduced RAVE data to the Besançon Model shows that the predicted results do not always correlate with the actual results.How should we change our model of the Galaxy to account for these differences?

l = 245 – 250 deg, b = 5 – 10 deg

l = 250 – 255 deg, b = 5 – 10 deg

l = 240 – 245 deg, b = 5 – 10 deg

Proper motions,

declination vs. right ascension for all stars within the area

l = 240.00 – 255.00 deg.

References

Ritter A., 2011

Robin A. et al.,

http://model.obs-besancon.fr/

Williams M.E.K et al.,

2011,

ApJ

, 728, 102