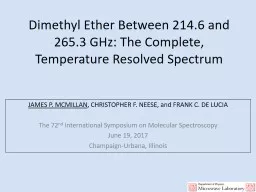
/
Dimethyl Ether Between 214.6 and 265.3 GHz: The Complete, Temperature Resolved Spectrum Dimethyl Ether Between 214.6 and 265.3 GHz: The Complete, Temperature Resolved Spectrum

Dimethyl Ether Between 214.6 and 265.3 GHz: The Complete, Temperature Resolved Spectrum - PowerPoint Presentation

pamella-moone
pamella-moone . @pamella-moone
Follow
371 views
Uploaded On 2018-02-01

Dimethyl Ether Between 214.6 and 265.3 GHz: The Complete, Temperature Resolved Spectrum - PPT Presentation

JAMES P MCMILLAN CHRISTOPHER F NEESE and FRANK C DE LUCIA The 72 nd International Symposium on Molecular Spectroscopy June 19 2017 ChampaignUrbana Illinois Motivations Primary Understand the complete contribution of each Weed to the Astrophysical data ID: 626888

line point list osu point line osu list ces experimental complete lines output blends data contaminant steps doppler evaluationmaking

Share:

Link:

Embed:

Download Presentation from below link

Download Presentation The PPT/PDF document "Dimethyl Ether Between 214.6 and 265.3 G..." is the property of its rightful owner. Permission is granted to download and print the materials on this web site for personal, non-commercial use only, and to display it on your personal computer provided you do not modify the materials and that you retain all copyright notices contained in the materials. By downloading content from our website, you accept the terms of this agreement.


Presentation Transcript

Slide1

Dimethyl Ether Between 214.6 and 265.3 GHz: The Complete, Temperature Resolved Spectrum

JAMES P. MCMILLAN, CHRISTOPHER F. NEESE, and FRANK C. DE LUCIAThe 72nd International Symposium on Molecular Spectroscopy June 19, 2017Champaign-Urbana, IllinoisSlide2

Motivations

Primary: Understand the complete contribution of each ‘Weed’ to the Astrophysical data Bonus: Obtaining Dipole Moments and Lower State Energies which may aide in QM assignments

Methodology

: Temperature Dependent Approach to Spectroscopy

ALMA Science Verification Data

Fortman et al.

J.Mol.Spectrosc

280:11-20

(2012)Slide3

Processing Steps

The Complete, Experimental ApproachDecontaminationPoint by Point Output EvaluationMaking a Line ListSlide4

Processing Steps

The Complete, Experimental ApproachDecontaminationPoint by Point Output EvaluationMaking a Line ListSlide5

Acquiring the Intensity Calibrated

Complete Experimental Spectrum (CES)

~1 K per scan

Local Thermodynamic Equilibrium

: Contamination


: Acquire

CES


: Pressure vs. Doppler Broadening


Steps:

10 Heaters

Sample

Transmitter

THz Source

Detector

6 meters

Butterfly ValveSlide6

The Point-by-point Technique

A(

)


K =


= W


Doppler width:

More constants:

Doppler Broadened Naperian Absorbance:

A(

)


 Slide7

The Point-by-point Technique


K =


= W


Doppler width:

More constants:

A(

)


Calibrate T and

nL

/Q

Generate

and


Input

Output

Fit a single scan; multiple lines

Fit a single frequency bin; all scans

 Slide8

The Point-by-point Technique

1.) Simply Download the table of

and

.

2.)Choose your temp and plot!

A(

)


Incomplete Methyl Formate Predictions

K =


= W


Doppler width:

More constants:


McMillan et al.

ApJ

823

:1 (2016)Slide9

Processing Steps

The Complete, Experimental ApproachDecontaminationPoint by Point Output EvaluationMaking a Line ListSlide10

Decontamination

‘Wheel-O-Contamination’

Untapped 210-270 data

MeCN

,

VCN

,

EtCN found in Dimethyl Ether

EtCN, VCN already published in 210 bandMeCN work product available to OSUSlide11

Decontamination

Find reference contaminant linesCalculate contaminant concentration for each scanSimulate contaminant signal and subtract from Dimethyl Ether signalSlide12

Decontamination

Successful Contaminant Removal:

Methyl Formate

Blends handled well

Peak intensities consistent with catalog predictions

Uncontaminated regions left unaffected

McMillan et al.

ApJ

823:1 (2016)Slide13

Decontamination

Successful Contaminant Removal:

Dimethyl Ether

MeCN

strongest contaminant at ~3%

EtCN

& VCN were 2nd order contaminants (0.1% of analyte)

Easier than:

MeOH

ApJ 795 56 (2014)

Methyl Formate

ApJ

823

:1 (2016)Slide14

Processing Steps

The Complete, Experimental ApproachDecontaminationPoint by Point Output EvaluationMaking a Line ListSlide15

Point by Point Output Evaluation


Error in Energy for

117

Strongest Lines at 300K

Error calculated against CDMS Catalog

RMS Error ~ 13.24 cm

-1

Consistent with previous point by point studies

Energies found by fitting:Slide16

Point by Point Output Evaluation

- CDMSCount of Lines Sorted by Intensity

-

Experiment

CDMS Catalog includes

only

the ground state

Thousands of new lines, many with nontrivial intensity.Boltzmann Factor for the first uncatalogued stateSlide17

Processing Steps

The Complete, Experimental ApproachDecontaminationPoint by Point Output EvaluationMaking a Line ListSlide18

OSU Line List vs CES

Errors in making the line list

OSU Line List is derived from OSU CES

Blends prove problematic

~1% of the 6000 + lines are affected

OSU CES reproduces experimental data well, even degenerate blendsSlide19

OSU Line List vs CES

OSU Line List is derived from OSU CES

Blends prove problematic

~1% of the 6000 + lines are affected

OSU CES reproduces experimental data well, even degenerate blends

Errors in making the line listSlide20

OSU Line List vs CES

OSU Line List is derived from OSU CES

Blends prove problematic

~1% of the 6000 + lines are affected

OSU CES reproduces experimental data well, even degenerate blends

Errors in making the line listSlide21

Summary

Complete ‘Point by Point’ Spectra has been producedThousands of new lines, many with nontrivial intensity.OSU Line Lists require minor corrections or separate analysisThanks to NASA and the NSF for funding this project.