PDF-Interferometric supermultispectral imagingKazuyoshi Itoh, Takashi Inou
Author : pamella-moone | Published Date : 2016-04-29
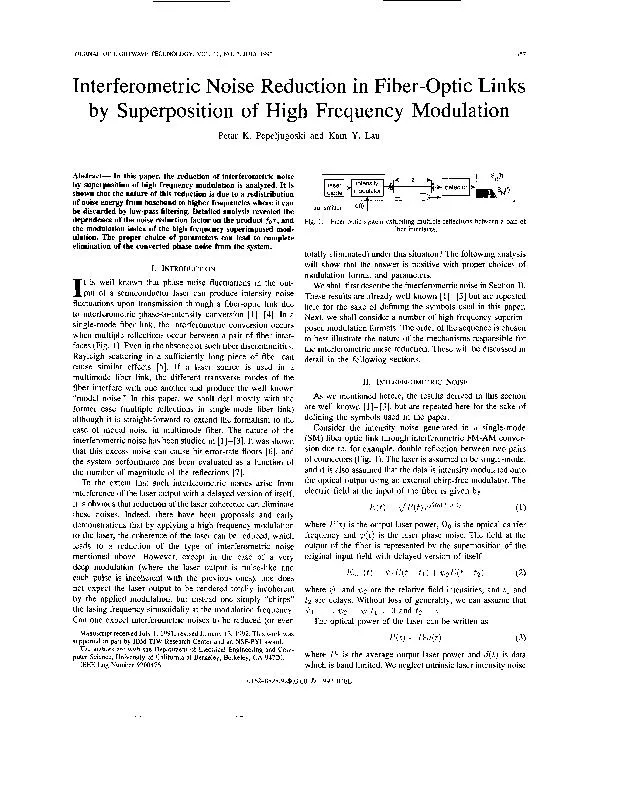
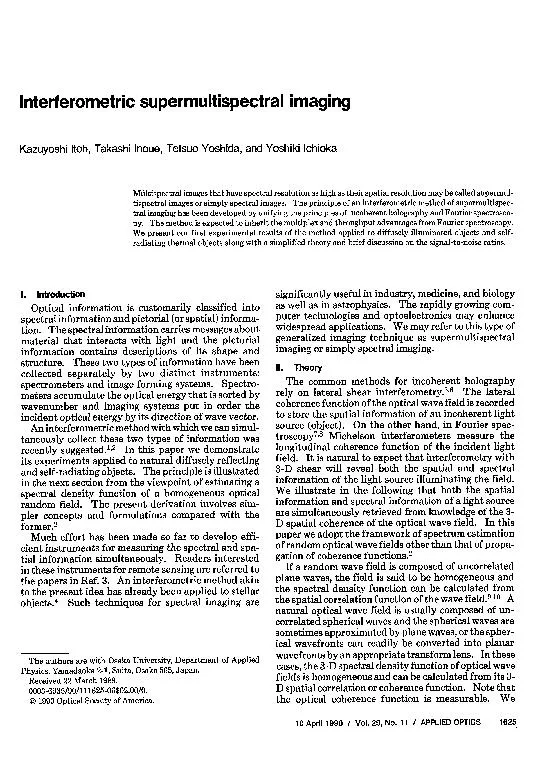
show that this spectral density function is the desiredspectral image of the light source illuminating thefieldLet us assume that we observe an incoherent objectwhich
Presentation Embed Code
Download Presentation
Download Presentation The PPT/PDF document "Interferometric supermultispectral imagi..." is the property of its rightful owner. Permission is granted to download and print the materials on this website for personal, non-commercial use only, and to display it on your personal computer provided you do not modify the materials and that you retain all copyright notices contained in the materials. By downloading content from our website, you accept the terms of this agreement.
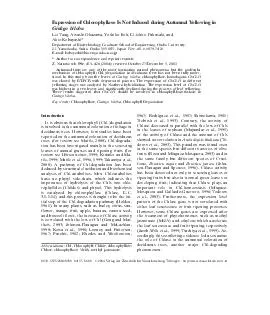
Interferometric supermultispectral imagingKazuyoshi Itoh, Takashi Inou: Transcript
Download Rules Of Document
"Interferometric supermultispectral imagingKazuyoshi Itoh, Takashi Inou"The content belongs to its owner. You may download and print it for personal use, without modification, and keep all copyright notices. By downloading, you agree to these terms.
Related Documents