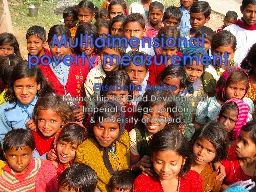
/
Multidimensional poverty analysis applied to the Roma Multidimensional poverty analysis applied to the Roma

Multidimensional poverty analysis applied to the Roma - PowerPoint Presentation

pamella-moone
pamella-moone . @pamella-moone
Follow
396 views
Uploaded On 2016-03-19

Multidimensional poverty analysis applied to the Roma - PPT Presentation

Andrey Ivanov Senior Policy Advisor UNDP BRC Eschborn 14 July 2013 Acknowledgements This presentation summarizes some preliminary results of an ongoing research based on the data come primarily from ID: 261669

poverty roma multidimensional undp roma poverty undp multidimensional living member analysis data 2013 andrey ivanov june applying access 2011

Share:

Link:

Embed:

Download Presentation from below link

Download Presentation The PPT/PDF document "Multidimensional poverty analysis applie..." is the property of its rightful owner. Permission is granted to download and print the materials on this web site for personal, non-commercial use only, and to display it on your personal computer provided you do not modify the materials and that you retain all copyright notices contained in the materials. By downloading content from our website, you accept the terms of this agreement.


Presentation Transcript

Slide1

Multidimensional poverty analysis applied to the Roma

Andrey Ivanov, Senior Policy Advisor, UNDP BRC

Eschborn

, 14 July 2013Slide2

Acknowledgements

This presentation summarizes some preliminary results of an ongoing research based on the data come primarily from

The regional Roma survey 2011 supported by the European Union (

DG Regional Policy), implemented by UNDP and the World Bank and administered by IPSOS, Serbia and The regional Roma survey 2004, supported by UNDP and administered by BBSS-Gallup, Bulgaria, TARKI, Hungary and Focus, Czech Republic.The data sets and the research papers based on the data available from the UNDP website: http://europeandcis.undp.org/ourwork/roma

Andrey Ivanov, UNDP: Applying multidimensional poverty analysis to Roma, 14 June 2013Slide3

Why focus on Roma?

“The largest European minority” – between 8 and 12 Mil people (or more?)

Represent an ultimate development challenge

A fundamental reformulation from “human rights” issue into “rights based development” issue“Schizophrenic combination” of “developing world” level of deprivation and “developed world” contextHeavily overrepresented among the poorHuge resources allocated already (and more to come under “Europe 2020”)A way of going “beyond NTL averages”What work for Roma might work for other similarly deprivedgroupsSlide4

Why multidimensional poverty?

Roma deprivation is not just a monetary poverty issue

Individual dimensions contribute differently to the overall deprivation outcome (status)

Makes possible building an integrated posture of the status (and thus link to the outrcomes of interventions)Slide5

Defining the target: Possible options

Self-identification (asking people, “Are you Roma?”)

Convenient

and politically safe (nothing is imposed on the respondent)……but doesn’t yield relevant data because of the vagueness of the question triggering additional ones in respondents’ minds, likeIf yes, does it mean I am not Romanian, Bulgarian, Slovak?Why do they ask – maybe to frame me?External (‘imposed’) identificationBy

non-Roma – verges on segregationist attitudes

By

Roma – “you may not know who we are – but we do”

Combined (multi-stage approach) – used in the surveys of UNDP (2004 and 2011) and of FRA (2011)

Andrey Ivanov, UNDP: Applying multidimensional poverty analysis to Roma, 14 June 2013Slide6

The UNDP/WB and FRA regional surveys

Provide quantifiable and comparable picture of the current situation of living conditions of Roma in the EU and non-EU countries (what is the

status

)Based on this, they send a message to policy-makers,Illustrate the dynamics over time of some basic indicators (what has changed since 2004)…to provide the ground for progress evaluation,Suggest possible correlations and causalities (what drives the status)

…to help answer the “why this status?”

question

Inform policymakers on possible priorities

…to suggest “what can be done” to achieve change

Andrey Ivanov, UNDP: Applying multidimensional poverty analysis to Roma, 14 June 2013Slide7

…and in other countries as well

Andrey Ivanov, UNDP: Applying multidimensional poverty analysis to Roma, 14 June 2013Slide8

The multidimensional poverty analysis

Data allows calculating

multidimensional

poverty rates and index – an aggregate measure of deprivation in 4 dimensions reflecting the priority areas of the Decade of Roma InclusionHealthEducationHousing and Standard of Living

Follows

Alkire

/Foster methodology

Based

on 12 indicators, 3 for

each dimension

A

person is considered poor if

s/he is deprived

in at least 6 of the 12 indicators and

severely

poor if

deprived

in 9 out of 12

indicators

Andrey Ivanov, UNDP: Applying multidimensional poverty analysis to Roma, 14 June 2013Slide9

Health dimension

Shares of the population not having access to essential drugs (1/12)

Any HH member living in a HH responding "yes" to the question "were there any periods in the past 12 months when your HH could not afford to buy medicines prescribed by a doctor”

Perceived vaccination rate (1/12)Any child aged 0-6 years old who has not received any or some of the obligatory vaccinationsMalnutrition (1/12)Any HH member living in a HH that experienced that in the past month somebody ever went to bed hungry because they could not afford enough food for them Slide10

Educational dimension

Highest completed education (1/12)

Any HH member of higher than primary education age with uncompleted primary education

Number of years in education (1/12)Any HH member with less than 5 years in educationGross enrolment rate in compulsory education (1/12)Any HH member aged 7-15 who is not attending school or trainingSlide11

“Basic infrastructures” dimension

Shares of the population not having access to improved water source (1/12)

Any HH member living in HHs not having piped water inside the dwelling or in the garden/yard

Shares of the population not having access to improved sanitation (1/12)Any HH member living in a HH without toilet or bathroom inside the houseAccess to electricity (1/12)Any HH member living in a HH with no access to electricity in their dwellingSlide12

“Standard of living” dimension

Shares of the population not having access to secure housing (1/12)

Any HH member living in "ruined houses" or "slums" (as assessed by the enumerator)

Access to various HH amenities (1/12)Any HH member living in a HH, which doesn't posses four of six categories falling in "UNDP material deprivation" indexAbsolute poverty rate (1/12)Any HH member living in a HH living in the households where the equivalent per capita income/expenditures are below $2.15 or $4.3 poverty linesSlide13

monetary and multidimensional

poverty

Andrey Ivanov, UNDP: Applying multidimensional poverty analysis to Roma, 14 June 2013Slide14

Poverty dynamics Slide15

“Poor” and “severely poor” 2004-2011Slide16

number of deprivations of M-poor, 2011Slide17

Individual dimensions’ contribution, 2011Slide18

More subtle details of deprivation…Slide19

The overall messages of the data

Certain progress in regards Roma inclusion has been made since the launch of the Decade of Roma inclusion

But unequal in all areas

Unequal between countriesQuantitative data is of paramount importance for establishing reliable and robust progress monitoring systemsBut quantitative data needs to be properly contextualized through qualitative researchAndrey Ivanov, UNDP: Applying multidimensional poverty analysis to Roma, 14 June 2013Slide20

Policy relevance

Still potential (hard to go beyond research and communication campaigns)

But promising (unlike 2004)

Hopefully will be used for monitoring the progress in Roma inclusion (both within the Decade of Roma Inclusion and the European Roma Policy Framework)Involving national institutions is keyBut difficult to various reasons (incl. vested interests)