/
State of the Industry Piecing Together the Wine Industry Supply/Demand Puzzle State of the Industry Piecing Together the Wine Industry Supply/Demand Puzzle

State of the Industry Piecing Together the Wine Industry Supply/Demand Puzzle - PowerPoint Presentation

pamella-moone
pamella-moone . @pamella-moone
Follow
346 views
Uploaded On 2019-06-23

State of the Industry Piecing Together the Wine Industry Supply/Demand Puzzle - PPT Presentation

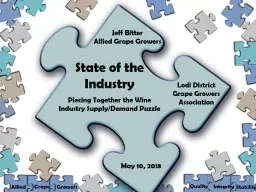
May 10 2018 Jeff Bitter Allied Grape Growers Lodi District Grape Growers Association Presentation Pieces California Supply Trends California Wine Shipments Lodi CropMarket Update Wine Shipments ID: 760081

Share:

Link:

Embed:

Download Presentation from below link

Download Presentation The PPT/PDF document "State of the Industry Piecing Together t..." is the property of its rightful owner. Permission is granted to download and print the materials on this web site for personal, non-commercial use only, and to display it on your personal computer provided you do not modify the materials and that you retain all copyright notices contained in the materials. By downloading content from our website, you accept the terms of this agreement.


Presentation Transcript

Slide1

State of the

IndustryPiecing Together the Wine Industry Supply/Demand Puzzle

May 10, 2018

Jeff BitterAllied Grape Growers

Lodi DistrictGrape GrowersAssociation

Slide2

Presentation Pieces

California

Supply

Trends

California

Wine

Shipments

Lodi

Crop/Market

Update

Slide3

Wine Shipments:

What are consumers buying?

Slide4

2017 Wine Shipments

Quote from the Annual

Gomberg

Fredrikson

Report (GFR):

“The U.S. market saw good growth with an increase of 9.7 million cases or just over 2% in 2017.”

Slide5

Wine Shipment HighlightsGomberg Fredrikson Report, 2017

Overall:

U.S. market grew to 407.2 million cases of wine

California wines to the U.S. market were up by 1%

Imported wines to the U.S. market were up by 7%

California wines were down overall by 1%

Imports/Exports:

Bottled imports were up 3%

Top importers (in order) were Italy, France, Australia, Chile, Argentina, New Zealand and Spain

Bulk imports were up by 19%

Top importers (in order) were Chile, Australia, New Zealand, Argentina, Italy and Spain

Bottled exports down 16%

Bulk exports were flat

Slide6

Wine Shipments

Are Premium Wine Growth Rates Slowing?

Slide7

Rolling 52-Week Sales Comparison of Wine, by Price

Source: With Permission - Silicon Valley Bank’s 2018 State of the Wine Industry Report

Wine Shipments

Is Premium Wine Growth Slowing?

Slide8

Premium Winery Sales GrowthSource: With Permission - Silicon Valley Bank’s 2018 State of the Wine Industry Report

Wine Shipments

Are Premium Wine Growth Rates Slowing?

Slide9

Wine Shipment HighlightsFor 2017, as compared to 2016

As reported by

Neilsen

<$4/bottle - down 4%

$4-8/bottle - down 4%

$8-11/bottle - up 1%

$11-15/bottle - up 7%

$15-20/bottle - up 10%

>$20/bottle - up 8%

As reported by the GFR

<$3/bottle - down 7%

$3-7/bottle - up 1%

$7-10/bottle - flat

$10-14/bottle - up 12%

$14-20/bottle - up 9%

>$20/bottle - up 8%

Slide10

Wine Shipment HighlightsGomberg Fredrikson Report, 2017

Varietal Volume Performance

(scan data in food stores only)

Chardonnay flat (value up 2%)

Pinot

Grigio

up 4%

Moscato up 2%

Sauvignon Blanc up 8% (value up 10%)

Other whites down 6%

White Zinfandel down 5%

Cab

Sauv

up 3% (value up 6%)

Red Blends up 2%

Merlot down 6%

Pinot Noir up 7% (value up 10%)

Red Zin down 6% (value down 1%)

Other reds up 3%

Slide11

Value Change, by Variety, for >$8/Bottle

2017 as compared to 2016

Source: With Permission - Silicon Valley Bank’s 2018 State of the Wine Industry Report

Slide12

Volume Growth by Variety and Price Range

Source: With Permission - Danny

Brager

, Nielsen Company

Slide13

What about

“trade wars?”

Slide14

Supply Trends:

What is our

winegrape

supply future?

Slide15

Supply Stability

Planting at Attrition Rate

(Forecast)

Slide16

Supply Stability

Production for 2018-2020 based on average yield of 7.2 tons/acre

Slide17

Huge preference toward reds:

72% red

28% white

Slide18

Segmenting Supply

North

Valley

(Daily Drinkers)

Central

Valley

(Value Wines)

California

Coastal

(Premiums)

<$6/bottle

$6-10/bottle

$10-20/bottle

>$20/bottle

AVA

Based

(Luxury Wines)

Slide19

Central

Valley

(Value Wines)

<$6/bottle

Slide20

Central Valley

Slide21

Central Valley

“The bottom line is that, following the 2015 crop, we will still need to remove about 36,000 acres…”

Slide22

Central Valley

(Forecast)

Doesn’t equal 36,000 acres

Slide23

North

Valley

(Daily Drinkers)

$6-10/bottle

Slide24

North Valley

(Forecast)

Slide25

North Valley

Regional Bright Spots/Opportunities

Premiumization

Potential

“Middle” of

the Market

Varietal

Diversity

Slide26

North Valley

Slide27

North Valley

Slide28

California

Coastal

(Premium Wines)

$10-20/bottle

Slide29

California Coastal

Slide30

California Coastal

Slide31

California Coastal

Regional Bright Spots/Opportunities

Epicenter of

Growth

AVA Extenders

andAlternatives

“Managed” Growth

Slide32

AVA

Based

(Luxury Wines)

>$20/bottle

Slide33

AVA Based

Reginal Market/Supply

Hot Topics

Relationship with

“The Economy”

Slide34

Premium Winery Sales GrowthSource: With Permission - Silicon Valley Bank’s 2018 State of the Wine Industry Report

AVA Based

Slide35

AVA Based

Sales Growth Rates of U.S. Luxury Goods

Source: With Permission - Silicon Valley Bank’s 2018 State of the Wine Industry Report

Slide36

AVA Based

Slide37

AVA Based

Slide38

Summing up Supply…

Slide39

Supply Stability

9,000 Net Acre

Reduction (-5%)

Slide40

Supply Stability

9,500 Net Acre

North ValleyAddition (+7%)

Overall Interior

Acres Flat

From 2016

Slide41

Supply Stability

16,500 Net Acre

Addition (+7%)

Most of the new acres came in 2017!

Slide42

The Lodi

Winegrape

Market

Hot or Not?

Slide43

Winegrape Crop Potential

Slide44

Whites:High level of interest in Sauvignon BlancBuyer interest/activity in Generic WhitesAverage interest/activity on ChardonnayVirtually no interest in Pinot GrigioStrong interest in florals with some offers/activity (mostly south)Blush/RoséPotential interest in reds for Rosé programs (Demand moves south)White Zin stable (mediocre) due to pullouts, early year activityReds:Strong interest in Pinot Noir (virtually none on the market)Relatively strong interest in Cabernet SauvignonPockets of interest for Petite Sirah/Teraldego and other blendersExtremely mild activity on ZinfandelNo “current” interest/activity for Merlot

Winegrape

Market Activity

Slide45

DomesticallyContinuing decline of wine shipments <$10/bottle“Ample” supply of Central Valley grapesSlowing growth rates of premium wines?“Skittish” purchasing behavior by buyers(Result is an inconsistent or non-fluid marketplace)GloballyGenerally negative consumption patternsCompetitor cost advantageTrade wars?

What Are Our Challenges?

Slide46

Wine consumers continue to be very fickle; they are not particularly loyal to California, readily looking to foreign alternatives.

Premiumization will continue as the dominate wine industry trend, as consumers trade up in quality, all while being value conscious.California will experience no material growth in bearing acreage through 2020, but higher yields and larger crops are likely.Producers will continue to adjust regional supply, in response to continually changing consumer preference.

Summary