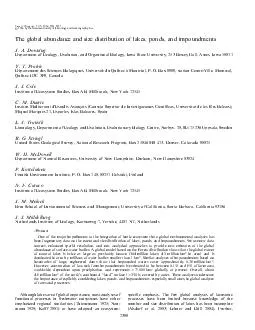
/
The global abundance and size distribution of lakes ponds and impoundme nts J The global abundance and size distribution of lakes ponds and impoundme nts J

The global abundance and size distribution of lakes ponds and impoundme nts J - PDF document

pamella-moone
pamella-moone . @pamella-moone
Follow
519 views
Uploaded On 2015-03-16

The global abundance and size distribution of lakes ponds and impoundme nts J - PPT Presentation

A Downing Department of Ecology Evolution and Organismal Biology Iowa State Uni versity 253 Bessey Hall Ames Iowa 50011 Y T Prairie De 57524partement des Sciences Biologiques Universite 57524 du Que 57524bec a Montre 57524al P O Box 8888 station Ce ID: 46386

Downing Department

Share:

Link:

Embed:

Download Presentation from below link

Download Pdf The PPT/PDF document "The global abundance and size distributi..." is the property of its rightful owner. Permission is granted to download and print the materials on this web site for personal, non-commercial use only, and to display it on your personal computer provided you do not modify the materials and that you retain all copyright notices contained in the materials. By downloading content from our website, you accept the terms of this agreement.


Presentation Transcript

J.J.Cole InstituteofEcosystemStudies,BoxAB,Millbrook,NewYork12545 C.M.Duarte InstitutMediterranid’EstudisAvanc ¸ats(ConsejoSuperiordeInvestigacionesCient ´ficas,UniversitatdelesIllesBelears), MiquelMarques21,Esporles,IslasBaleares,Spain L.J.Tranvik Limnology,DepartmentofEcologyandEvolution,EvolutionaryBiologyCe ntre,Norbyv.20,SE-75236Uppsala,Sweden R.G.Striegl fornia,SantaBarbara,California93106 J.J.Middelburg NetherlandsInstituteofEcology,Korinaweg7,Yerseke,4401NT,Netherl ands Abstract Oneofthemajorimpedimentstotheintegrationoflenticecosystemsintog lobalenvironmentalanalyseshas beenfragmentarydataontheextentandsizedistributionoflakes,ponds, andimpoundments.Weusenewdata sources,enhancedspatialresolution,andnewanalyticalapproachestop rovidenewestimatesoftheglobal ributionshowsthattheglobalextent ofnaturallakesistwiceaslargeaspreviouslyknown(304millionlakes;4 .2millionkm 2 inarea)andis dominatedinareabymillionsofwaterbodiessmallerthan1km 2 .Similaranalysesofimpoundmentsbasedon inventoriesoflarge,engineereddamsshowthatimpoundedwaterscoverap proximately0.26millionkm 2 . processeshavebeenlimitedbecauseknowledgeofthe numberandsizedistributionoflakeshasbeenincomplete (Alsdorfetal.2003;LehnerandDo ¨ll2004).Further, Limnol.Oceanogr., 51(5),2006,2388–2397 E 2006,bytheAmericanSocietyofLimnologyandOceanography,Inc. 2388 pondscanbeconsideredtobe0.001km 2 andthemaximum lakesizethatoftheCaspianSea(378,119km 2 ).The shapeparameter c istheexponentdescribingtherateat whichprobabilitydeclineswithincreasingsize.Thus, c canbeefficientlyestimatedasthenegativeslopeofthe plotofthelogarithmoftheprobabilitythatalake chosenatrandomwillbeofarea( a )greaterthan A as afunctionofthelogarithmof A .Inotherwords, c isequal to  b inEq.3.IfageneralParetodistributionforworld lakescanbediscoveredandshowntohaveinterregional Fig.2.Relationshipbetweenlakesurfaceareaandarealfrequenciesofdi fferentsizedlakes, determinedbydetailedGISanalyses( seesourcesinTable1 )andcomprehensivecounts.Thefilled dotsindicatethefrequenciesoflakesizesfoundbySchuiling(1977)andM eybeck(1995).Other regions’lakefrequenciesareshownbyvarioussymbols. Fig.3.Geographicalanalysisofthepredictedworlddistributionofdens ities(d L ;Eq.2)oflakesbetween1km 2 and10km 2 surface area.PredictionsfollowaworldGISmodelofannualrun-off(Feketeetal. 2005)withageographicalresolutionof0.5 u oflatitudeand longitude.Lakedensitiesareshowninlakesper10 6 km 2 . Lakeabundanceandsizedistribution 2391 generality,thenwecancalculatetheglobalextentofall sizesoflakes. FitoflakeareafrequenciestotheParetodistribution— To testlakesizedistributionsforgeneralfittothePareto distribution,wecollectedinventoriesofalllakeswithin avarietyofgeographicalsettingsrepresentingdivergent topographyandgeology.Datanotderivedfrompublished sources(Table1)weredeterminedfromregionalGIS analysesusingARCView(ESRI).Datawerescrutinized forevidenceofundersamplingatsmalllakesizestoinclude onlyuntruncated,uncensoreddata(Hamiltonetal.1992). Figure4andTable1showstronginterregionalsimilarity intheslopesofthesedistributionalcurves.Because differentregionsholddifferingtotalnumbersoflakes andtheirlargestlakesdifferinsize,curvesarelocatedat differentpointsalongtheabscissa.TheParetodistribution showsasimilarrateofdeclineinabundancewithincreased lakesize,regardlessoftheregionoftheearthexamined. Giventhatthesize–frequencydistributionsoflakes followaParetodistributioninmanyregionsdowntovery smalllakesizes(Fig.4),canonicaldataontheabundance oftheworld’slargestlakesshouldenabletheanchoringof Eq.3andthecalculationoftheworldwideabundanceof lakes.Herdendorf(1984)inventoriedtheworld’slargest lakestodocumentthedominanceofthe251largestlakesin theworld’sfreshwatersupply(Fig.4).Heconcludedthat thegreatestimpedimenttothisworkwasthepaucityof accuratemaps.LehnerandDo ¨ll(2004)haverecentlyused GISanalysistodevelopandvalidateagloballake database.Theycombinedanaloganddigitalmapswith databases,registers,andinventoriesoflakestopresentalist of  250,000waterbodies.Consideringonlythe17,357 naturallakes  10km 2 inareaincludedintheiranalysis,we calculateEq.3byleastsquaresregression: N a  A  195,560 A  1  06079  5  ( r 2  0.998; n  17,357; SE b  0.0003).Theexponentof thisrelationship( b , Eq.3 ;– c , Eq.4 )isnearthemiddleof thoseseeninregionalanalyses(Table1)andthetwo canonicallakeareadatasetsdescribeanidenticallakesize distribution(Fig.4).Orthogonalregressionyieldeda99.9 % confidenceintervaloftheestimated b from  1.06245to  1.06056.Theaccuracyandprecisionoftheestimateof b isveryimportantbecausecalculatedlakesizedistribu- tionsandareasareverysensitivetothisparameter.Because theshapeofParetodistributionsissimilaramongdiverse regionsoftheearth(Table1;cf.,LehnerandDo ¨ll2004) andtheparametersofthisdistributionareestimablefrom thecanonicaldatasets,wecanthuscalculatetheglobal extentofpondsandlakes. Thenumberoflakesintheworldcanbecalculated followingtheapproachofVidondoetal.(1997).From Eq.5, c oftheParetodistributionis1.06.Giventhatwe definetherangeoflakesizesas0.001to378,119km 2 (the CaspianSea),integrationofEq.4willindicatethefraction ofalltheworld’slakesandpondsthatiscontainedwithin anyrangeofareas.Agoodestimateof k is0.001km 2 becausethisisthesmallestsizeofpondpractically recognizableinlandscapes.Thefractionofallworldlakes thatarerepresentedbythoseinthecanonicaldataset( f c ) canbecalculatedasfollows: f c  k c  A  c c max  A  c c min   6  where A c min and A c max aretheminimumandmaximum areasoflakesfoundinthecanonicaldataset(i.e.,10and 378,119)and c isthenegativeoftheexponent( Eq.5 )found  CoefficientsofEq.3fittedbyleastsquaresregression.GISdatawereder ivedfromoriginalGISanalyzedbytheauthorsof thisstudy.DatasourcesfororiginalGISanalysesarenotedifthedatawer enotthepropertyoftheauthors. Dataset Exponent ( b ,Eq.3; c ,Eq.4) Smallestreliable size(km 2 ) Numberoflakes analyzed( a )Source L’Estrie(Que ´bec,Canada)  0.660.0013,398GIS(Y.T.Prairieunpubl.data) Abitibi(Que ´bec,Canada)  0.670.0011,020GIS(Y.T.Prairieunpubl.data) Finland  0.690.00957,205(RaatikainenandKuusisto1988) EasternLakesSurvey(U.S.A.)  0.760.11,264(Linthurstetal.1986;Landersetal. 1988) WesternEurope  0.775751(Schuiling1977) WesternLakesSurvey(U.S.A.)  0.780.01752(Clowetal.2003) Amazonbasin(SouthAmerica)  0.790.14,482(Sippeletal.1992;Hamiltonetal.1992) Adirondacks(U.S.A.)  0.790.012,125GIS(J.J.Coleunpubl.data) Medianofregionalestimates  0.79 World’slargelakes  0.83–251(Herdendorf1984) Florida(U.S.A.)  0.880.055,346(Shaferetal.1986) Meanofregionalestimates  0.89 Laurentides(Que ´bec,Canada)  0.900.001562GIS(Y.T.Prairieunpubl.data) World’slargestlakes  1.061017,357(LehnerandDo ¨ll2004) Oklahoma(U.S.A.)  1.190.1444GIS(OklahomaCenterforGeospatial Information2004) Orinocobasin(SouthAmerica)  1.220.1956(HamiltonandLewis1990;Hamiltonet al.1992) NorthDakota(U.S.A.)  1.3340.0017,239GIS(NorthDakotaStateWater Commission2003) 2392 Downingetal. forthecanonicaldataset.SolvingEq.6indicatesthatthe canonicallakedatasetcontainedafractionoftheworld’s lakesequalto5.712 3 10  5 .Divisionofthenumberof canonicallakesusedtocalculateEq.5bythisfraction estimatesthatthereareintheneighborhoodof304million pondsandlakes(  0.001km 2 )intheworld.Thistotal numberofworldlakesisdefinedasN t . Further,becauseEq.3fitsconsistentlyoverawiderange oflakeareas(Fig.4andTable1)andbecauseEq.5 anchorsthiscanonicalfrequencydistributiontotheknown sizesoftheworld’slargestlakes,thenumberofworldlakes canbeapproximatedoveranysizerange.If A min and A max aretheminimumandmaximumsizesoflakesinagiven sizerange,thenumberoflakesoverasizerangecanbe calculated: N A max  A min  N t k c A  c max  A  c min   7  (seeTable2).Because c isgreaterthanunity,Eq.7shows thattherearemanysmalllakesandfewlargelakes. Likewise,theaveragesizeandtotalareacoveredbylakes inagivensizerangecanbecalculatedusingthePareto distribution(Vidondoetal.1997).Aftersimplification,the averageareaoflakesoverasizerangeof A min to A max can becalculated:  A A A min  A max  c   A max A c min  A c max A min c  1  A c max  A c min   8  Thetotallandareacoveredbylakesofanysizerangecan becalculatedastheproductofEqs.7and8. Analysesofcanonicallakedataandtheexponentsof ParetodistributionsoflakesizesderivedbyregionalGIS revealsomesurprises.Contrarytopreviouspredictions (Schuiling1977;Wetzel1990;Meybeck1995;Kalff2001), smalllakes,notlargeones,appeartorepresentthemost lacustrinearea.Althoughlakes  10,000km 2 inindividual lakeareaconstitutenearly1 3 10 6 km 2 ,theselakesmakeup onlyabout25 % oftheworldlakearea.Together,thetwo smallestsizecategoriesoflakesinTable2comprisemore areathanthethreelargestsizecategories.Whenconvertedto d L units(numberper10 6 km 2 ofEarth’ssurface;Table2), extensionofcanonicallakedatatosmalllakesusingthe ParetodistributiontracksRobertWetzel’sconcept(Wetzel 1990)ofthelikelyabundanceofsmalllakes(seeFig.1). Undercountingsmalllakeshasledtosignificantunder- estimatesoftheworldlakeandpondarea.Worldlakesand pondsaccountforroughly4.2 3 10 6 km 2 ofthelandarea oftheearth.Thismorethandoublesmostquantitative historicestimates(Kalff2001;Wetzel2001;Shiklomanov andRodda2003).Naturallakesandponds  0.001km 2 compriseroughly2.8 % ofthenon-oceaniclandarea;not 1.3–1.8 % aspreviouslysupposed. Reservoirsandimpoundments— Theforegoinganalysis madeeveryattempttoexcludeconsiderationofanthropo- genicimpoundmentsofwater.Artificialwaterbodiescan, however,beofgreatimportanceinmanyprocesses(Dean andGorham1998;St.Louisetal.2000)andshouldbe includedinglobalanalyses.Thesizedistributionsof naturallakesandimpoundmentsarebothextensionsof Fig.4.PlotsofdataontheaxesimpliedbyEq.3.StatisticalfitsofEq.3to thesedataare showninTable1.Dataareonlyplottedthroughouttherangeoflakesizesth atcouldbe reasonablyexpectedtobecomprehensivelycensusedusingtheresolution ofGIScoverages available(seeTable1).Theblacklinesrepresentcanonical(complete)c ensusesofworldlakes (Herdendorf1984;LehnerandDo ¨ll2004). Lakeabundanceandsizedistribution 2393 theearth’shypsometry(Strahler1952),whichisfunda- mentallyinfluencedbytheerosionalforceofthewater supply.Aslandscapesarecoveredwithimpoundedwater, however,smalldepressionsareaggregatedintolargerlakes. ExpressedintermsofaneffectontheParetodistribution, thiscouldlead c (Eq.4)tobelarger. Becausetheearthclearlyhasmoresmalldepressions thanlargeones(bothdryandwet),itislikelythataPareto distributioncouldfitforimpoundmentsaswellasfor naturallakes.Infact,Eq.2suggeststhattherearewater- richregionsoftheearththatareunderservedbynatural lakesowingtotheirtilted,erosional,river-dominated topographycausedbyveryhighrun-off(Fig.3).As humansinstallimpoundmentsinmoreofthedepressions thatwillholdwater,impoundedwaterscouldcovereven moreareathannaturallakes,whilefollowingsimilarsize distributions.Ifmorelargeimpoundmentsarebuiltthan smallones,however,therecouldbedifferencesinthe exponentsoftherelationshipsofthetypeshowninEq.3 fornaturalandimpoundedwaterbodies. Theareaimpoundedbylargedamsisincreasing worldwide.Ithasbeenestimatedthatthevolumeofwater inimpoundmentsincreasedbyanorderofmagnitude betweenthe1950sandthepresent(Shiklomanovand Rodda2003).Asanexample,Fig.5showsthetrendinthe areacoveredbyimpoundmentsintheUnitedStates.The semi-logtrendisapproximatelylinearfrom1700to present,butdeceleratedaround1960.Theannualaverage rateofincreaseinimpoundedareaduringthistermwas about4 % .Therateofincreasesince1960hasslowedto about1 % peryearperhapsbecauseoftheincreasingrarity ofvacantland. TheInternationalCommissiononLargeDams(ICOLD; www.icold-cigb.org)tracksdataondamsaroundtheworld thatareofsafety,engineering,orresourceconcern.These dataarepurposefullybiasedtowardlargedams,most notablythose  15mheight.Thedataarethuslikelyto providethebestestimateofimpoundmentswiththelargest impoundedareasandprogressivelylessexhaustivecover- ageofsmallerimpoundments.Restrictingananalysisof Eq.3tothe41largestimpoundmentsfromtheInguri impoundment(13,500km 2 )downto1,000km 2 yields N a  A  2,922,123 A  1  4919  9  ( r 2  0.97; n  41; SE b  0.0435).Thestronglynegative exponentofthisequationindicatesthatthesmallestofthe largeimpoundmentscomprisemoresurfaceareathanthe  Thenumbers,averagesizes,andareasofworldlakescalculatedfromEqs.7 and8.Thetotalareaoflakesinthesizerange iscalculatedastheproductofcalculationsfromEqs.7and8.Valuesarein clusiveoflowerboundsbutexclusiveofupperbounds. A min (km 2 ) A max (km 2 )Numberoflakes Averagelake area(km 2 ) Totalareaof lakes(km 2 ) d L (lakesper 10 6 km 2 )Source 0.0010.01277,400,0000.0025692,6001,849,333Eqs.7,8 0.010.124,120,0000.025602,100160,800Eqs.7,8 0.112,097,0000.25523,40013,980Eqs.7,8 110182,3002.50455,1001,215Eqs.7,8 1010015,90524.7392,362106Lehnerand Do ¨ll(2004) 1001,0001,330248329,8169Lehnerand Do ¨ll(2004) 1,00010,0001052,456257,8560.7Lehnerand Do ¨ll(2004) 10,000100,0001637,978607,6500.1Lehnerand Do ¨ll(2004)  100,0001378,119378,1190.007Lehnerand Do ¨ll(2004) Alllakes304,000,0000.0124,200,000 Fig.5.RateofchangeinimpoundedareaintheUnited Statesforallwaterimpoundmentswithdamslistedaspotential hazardsorlowhazarddamsthatareeithertallerthan8m, impoundingatleast18,500m 3 ,ortallerthan2m,impoundingat least61,675m 3 ofwater(USACOE1999).Alldatawereignored wherethedateofdamconstructionwasunknown(ca.12 % of impoundedarea)ornaturallakes(e.g.,LakeSuperior)werelisted asimpoundments.Thedashedlineshowsasemi-logregression ( r 2  0.95). 2394 Downingetal. largestofthem.Theintentionalbiasofthisdatasettoward largedamsprogressivelyincreasestheexponentofthis equationassmallerimpoundmentsareincluded.The averagerelationship,consideringalloftheICOLD impoundmentsdownto1km 2 ,is N a  A  20,107 A  0  8647  10  ( r 2  0.97; n  9,604; SE b  0.0154).Integrationofthis equationcertainlyresultsinanunderestimateofthearea coveredbyimpoundments(cf.,Eqs.9and10)becauseit ignoresmanyimpoundmentsformedbysmalldams. CalculationsfollowingEqs.6–8(Table3)show,however, thatthereareatleast0.5millionimpoundments  0.01km 2 intheworld,andtheycover  0.25millionkm 2 oftheearth’slandsurface.Thisisasmallerareathan estimatesbasedonextrapolation(DeanandGorham1998; St.Louisetal.2000;ShiklomanovandRodda2003)but nearlyidenticaltoGIS-basedestimates(LehnerandDo ¨ll 2004).Largeimpoundmentdatasets(e.g.,Smithetal. 2002)suggestthatsmallimpoundmentscoverlessareathan largeones(Table3). Theprecedinganalysisincludesonlythoseimpound- mentswithlarge,engineereddamsandignoressmall impoundmentscreatedusingsmall-scaletechnologies.The areacoveredbysmallimpoundmentshaslargelybeen amatterofspeculation(St.Louisetal.2000).Farmand agriculturalpondsareagrowingandgloballyuninventor- iedresource.Theyareconstructedassourcesofwaterfor livestock,sourcesofirrigationwater,fishcultureponds, recreationalactivities,sedimentationponds,andwater qualitycontrolstructures. Figure6showstheareaofwaterimpoundedby agriculturalpondsinseveralpoliticalunits.Thereis climaticregularityinthefractionoffarmlandthatis convertedtopondstructures.Underdryconditions,farm pondsarerare,owingtothedifficultyofcollectionand conservationofsufficientstandingwater.Uptoabout 1,600mmofannualprecipitation,farmpondsarean increasingfractionoftheagriculturallandscape.Inmoist climatessuchasGreatBritain,Tennessee,andMississippi, farmpondsmakeup3–4 % ofagriculturalland. Thestatistical–climaterelationshipshowninFig.6was usedwithdataonareaunderfarmingpractice,pondsize, andestimatesofannualaverageprecipitation(FAO2003) toestimatetheglobalareacoveredbyfarmpond impoundments.Thisareasumsto76,830km 2 worldwide. Theaccuracyofpredictionsoffarmpondareawereverified usingpublisheddataonfarmlandareas(USDA2004)and normalprecipitationaverages(NOAA2000)fortheUnited States.Thismethodestimatestheareaoffarmpondsinthe contiguousUnitedStatestobe21,600km 2 ,remarkably closetothe21,000km 2 estimatedbyGIS(Smithetal. 2002).Thepredictedworldareaoffarmpondsismorethan sixtimestheareapredictedbyextrapolationofthelarge damsdatabaseandnearlydoublethetotalareacoveredby impoundmentsbetween100km 2 and1,000km 2 inarea (Table3).Suchsmallimpoundmentsaregrowingin importanceatannualratesofincreasefrom0.7 % inGreat Britain,to1–2 % intheagriculturalpartsoftheUnited   Thenumbers,averagesizes,andareasofworldwaterimpoundmentscalcula tedfromEqs.7,8,and10.Thetotalareaof impoundmentsinthesizerangeiscalculatedastheproductofcalculation sfromEqs.7and8.Valuesareinclusiveoflowerboundsbut exclusiveofupperbounds. A min (km 2 ) A max (km 2 ) Numberof impoundments Averageimpoundment area(km 2 ) Totalareaof impoundments(km 2 ) d L (impoundments per10 6 km 2 ) 0.010.1444,8000.02712,0402,965 0.1160,7400.27116,430405 1108,2952.7122,44055.3 101001,13327.130,6407.55 1001,00015727141,8501.05 1,00010,000212,70657,1400.14 10,000100,000327,06078,0300.02 Allimpoundments515,1490.502258,570 Fig.6.Relationshipbetweenthesurfaceareaoffarmponds andtheannualaverageprecipitationinseveralpoliticalunits. DatasourcesforfarmpondnumbersaregiveninWebAppendix 1.Thelineisaleastsquaresregression( r 2  0.80, n  13)where theareaoffarmpondsexpressedasapercentageoftheareaof farmland(FP)riseswithannualaverageprecipitation(P;mm)as FP  0.019e 0.0036P . Lakeabundanceandsizedistribution 2395 States,toindryagriculturalregionsofIndia(seereferencesinWebAppendix1,http://www.aslo.org/lo/toc/vol_51/issue_5/2388a1.pdf).ConsistentregionalhypsometrypermitscalculationofthesizedistributionandareacoveredbylakesbyanchoringaParetodistributionfunctiontoacanonicalsizedistribu-tionoftheearth’slargestlakes.Naturallakesandpondsareestimatedtocoverabout4.2millionkmoftheearth’ssurface(Table2),whereasimpoundmentscover260,000km(Table3),andfarmpondscoverabout77,000km.Thesedata,takentogether,indicatethatlakes,ponds,andimpoundmentscoveroftheearth’ssurface.Thisismorethantwiceasmuchasindicatedbypreviousinventoriesbecausesmalllakeshavebeenunder-censused.Onaglobalscale,ratesofmaterialprocessing(e.g.,carbon,nitrogen,water,sediment,nutrients)byaquaticecosystemsarelikelytobeatleasttwiceasimportantashadbeenpreviouslysupposed.Sincethenumericalandarealcoverofsmallwaterbodiesismuchgreaterthanwaspreviouslyassumed,processesthataremostactiveinsmalllakesandpondsmayassumeglobalsignificance.Onalocalscale,previousanalyseshadindicatedthatsmallaquaticsystemswerespatiallyunimportant,yetsmallwaterbodiesdominatetheglobalareacoveredbycontinentalwaters.Becausestudiesofsmallaquaticsystemshavebeenunderemphasized,futureworkshouldemphasizetheglobalroleandcontributionofsmallwaterbodies.,D.,D.LC.V.2003.Theneedforglobal,satellite-basedobservationsofterrestrialsurfacewaters.EOS269,275–276.,D.W.,.2003.Changesinthechemistryoflakesandprecipitationinhigh-elevationnationalparksinthewesternUnitedStates,1985–1999.WaterResour.Res.1171,[doi:10.1029/2002WR001533].,J.J.,N.F.C.2001.Carbonincatchments:Connectingterrestrialcarbonlosseswithaquaticmetabolism.Mar.Freshwat.Res.,W.E.,E.G.1998.Magnitudeandsignificanceofcarbonburialinlakes,reservoirs,andpeatlands.Geology,M.,N.HB.P.1993.Statisticaldistributions.2nded.JohnWileyandSons.FAO.2003.Aquastatdatabase.FoodandAgricultureOrganiza-tionoftheUnitedNations.,B.M.,C.J.VW.G.2005.UNH/GRDCcompositerunofffields.V1.0.UniversityofNewHampshireandGlobalRunoffDataCentre.,L.2004.Lakes:Formandfunction.TheBlackburn,W.1922.DieSeenderErde.Peterm.Mitteilungen,1–169.[InGerman.]AMILTON,S.K.,ANDW.M.LEWIS.1990.PhysicalcharacteristicsofthefringingfloodplainoftheOrinocoRiver,Venezuela.Interciencia491–500.[InSpanish.]———,J.M.M,M.F.GW.M.L1992.Estimationofthefractaldimensionofterrainfromlakesizedistributions,p.145–164.G.E.PettsandP.A.Carling[eds.],Lowlandfloodplainrivers:Ageomorphologicalper-spective.Wiley.ERDENDORF,C.E.1984.Inventoryofthemorphopmetricandlimnologiccharacteristicsofthelargelakesoftheworld,technicalbulletin.TheOhioStateUniv.SeaGrantIPCC.2001.Thecarboncycleandatmosphericcarbondioxide,p.183–237.IPCC,ClimateChange2001.CambridgeUniv.,J.2001.Limnology:Inlandwaterecosystems.Prentice,D.H.,W.S.O,R.A.LD.A..1988.Easternlakesurvey:Regionalestimatesoflakechemistry.Environ.Sci.Tech.,B.,P.D.2004.Developmentandvalidationofaglobaldatabaseoflakes,reservoirsandwetlands.J.Hydrol.,R.A.,D.H.L,J.M.E,D.F.B,W.S.O,E.P.MR.E.C.1986.Populationdescriptionsandphysico-chemicalrelationships,p.136.CharacteristicsoflakesoftheeasternUnitedStates.V.1.U.S.EnvironmentalProtectionAgency.,M.1995.Globaldistributionoflakes,p.1–35.Lerman,D.M.ImbodenandJ.R.Gat[eds.],Physicsandchemistryoflakes.Springer-Verlag.,E.1929.Thescopeandchiefproblemsofregionallimnology.InternationalRevuedergesamtenHydrobiologieNOAA.2000.State,regionalandnationalmonthlyprecipitationweightedbyarea;1971–2000(andpreviousnormalsperiods),HistoricalClimatologySeries,p.17.NationalOceanicandAtmosphericAdministration,NationalEnvironmentalSatel-lite,Data,andInformationService,NationalClimaticData.2003.NorthDakotastate-widearealhydrologicfeatures[Internet].Bismarck(ND):NorthDakotaStateWaterCommission;[accessed2004March].Availablefromhttp://www.state.nd.us/gis/ENTERFOR2004.Inlandwaterresources:AllOklahomalakes[Internet].Stillwater(OK):OklahomaStateUniversity/StrategicConsultingIn-ternational;[accessed2004March].Availablefromhttp://,M.L.,Y.T.P.2004.Respirationinlakes.A.delGiorgioandP.J.L.Williams[eds.],Respirationinaquaticsystems.OxfordUniv.Press.,V.1897.Coursd’e´conomiepolitique.Lausanne.AATIKAINEN,M.,ANDE.KUUSISTO.1988.Suomenja¨rvien¨ra¨japinta-ala.TerraCHUILING,R.D.1977.Sourceandcompositionoflakesediments,p.12–18.H.L.Golterman[ed.],Interactionbetweensedimentsandfreshwater.ProceedingsofaninternationalsymposiumheldatAmsterdam,theNetherlands,September6–10,1976.Dr.W.JunkB.V.,S.A.1956.EvolutionofdrainagesystemsandslopesinbadlandsatPerthAmboy,NewJersey.Bull.Geol.Soc.Amer.,M.D.,R.E.D,J.P.HW.C.H1986.GazetteerofFloridalakes.WaterResourcesResearchCenterofFlorida.HIKLOMANOV,I.A.,J.C.RODDA.2003.Worldwaterresourcesatthebeginningofthetwenty-firstcentury.CambridgeUniv.Press.IPPEL,S.J.,S.K.HAMILTONANDJ.M.MELACK.1992.InundationareaandmorphometryoflakesontheAmazonRiverfloodplain,Brazil.Arch.Hydrobiol.385–400.[In2396Downingetal. S MITH ,S.V.,W.H.R ENWICK ,J.D.B ARTLEY , AND R.W. B UDDEMEIER .2002.Distributionandsignificanceofsmall, artificialwaterbodiesacrosstheUnitedStateslandscape.Sci. TotalEnviron. 299: 21–36. S OBEK ,S.,G.A LGESTEN ,A.-K.B ERGSTRO ¨ M ,M.J ANSSON , AND L.J. T RANVIK .2003.Thecatchmentandclimateregulationof pCO 2 inboreallakes.GlobalChangeBiol 9: 630–641. St.L OUIS ,V.L.,C.A.K ELLY ,E.D UCHEMIN ,J.W.R UDD , AND D. M.R OSENBERG .2000.Reservoirsurfacesassourcesof greenhousegasestotheatmosphere:Aglobalestimate. BioScience 50: 766–775. S TRAHLER ,A.N.1952.Hypsometric(area-altitude)analysisof erosionaltopography.Bull.Geol.Soc.Amer. 63: 1117– 1142. T HIENEMANN ,A.1925.DieBinnengewa ¨sserMitteleuropas:Eine LimnologischeEinfu ¨hrung.E.Schweizerbart’scheVerlags- buchhandlung.[InGerman.] USCOE.1999.Nationalinventoryofdams.UnitedStatesArmy CorpsofEngineers.[Availableonlineathttp://crunch.tec. army.mil/nid/webpages/nid.html]. USDA.2004.2002Censusofagriculture;summaryandstate data,GeographicAreaSeries.UnitedStatesDepartmentof Agriculture,NationalAgriculturalStatisticsService. V IDONDO ,B.,Y.T.P RAIRIE ,J.M.B LANCO , AND C.M.D UARTE . 1997.Someaspectsoftheanalysisofsizespectrainaquatic ecology.Limnol.Oceanogr. 42: 184–192. W ETZEL ,R.W.1990.Land-waterinterfaces:Metabolicand limnologicalregulators.Int.Verein.Theor.Limnol.Verh. 24: 6–24.[InGerman.] ———.2001.Limnology:lakeandriverecosystems.Academic Press. Received:10July2005 Accepted:5March2006 Amended:6April2006 Lakeabundanceandsizedistribution 2397