PPT-Years of treating laminitis and navicular syndrome cases with a natural hoof care system
Author : pamella-moone | Published Date : 2020-01-16
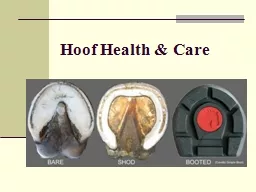
Years of treating laminitis and navicular syndrome cases with a natural hoof care system 3 has revealed a pattern as soundness increases heel depth as observed on
Presentation Embed Code
Download Presentation
Download Presentation The PPT/PDF document "Years of treating laminitis and navicula..." is the property of its rightful owner. Permission is granted to download and print the materials on this website for personal, non-commercial use only, and to display it on your personal computer provided you do not modify the materials and that you retain all copyright notices contained in the materials. By downloading content from our website, you accept the terms of this agreement.
Years of treating laminitis and navicular syndrome cases with a natural hoof care system: Transcript
Download Rules Of Document
"Years of treating laminitis and navicular syndrome cases with a natural hoof care system"The content belongs to its owner. You may download and print it for personal use, without modification, and keep all copyright notices. By downloading, you agree to these terms.
Related Documents