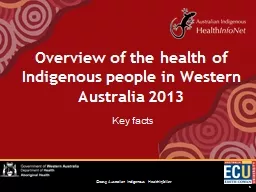
/
Key  facts Overview  of the health of Indigenous people in Western Australia 2013 Key  facts Overview  of the health of Indigenous people in Western Australia 2013

Key facts Overview of the health of Indigenous people in Western Australia 2013 - PowerPoint Presentation

pasty-toler
pasty-toler . @pasty-toler
Follow
407 views
Uploaded On 2018-03-11

Key facts Overview of the health of Indigenous people in Western Australia 2013 - PPT Presentation

Indigenous population At 30 June 2011 the estimated Western Australian Indigenous population was 88277 In 2011 around 96 of Indigenous people living in WA were Aboriginal 19 were Torres Strait Islanders and 19 of people identified as being of both Aboriginal and Torres Strait Islander ID: 647237

people indigenous times rate indigenous people rate times age 2008 higher 2010 2011 2005 years 2004 death living disease

Share:

Link:

Embed:

Download Presentation from below link

Download Presentation The PPT/PDF document "Key facts Overview of the health of In..." is the property of its rightful owner. Permission is granted to download and print the materials on this web site for personal, non-commercial use only, and to display it on your personal computer provided you do not modify the materials and that you retain all copyright notices contained in the materials. By downloading content from our website, you accept the terms of this agreement.


Presentation Transcript

Slide1

Key facts

Overview

of the health of Indigenous people in Western Australia 2013Slide2

Indigenous population

At 30 June 2011, the estimated Western Australian Indigenous population was 88,277.

In 2011, around 96% of Indigenous people living in WA were Aboriginal, 1.9% were Torres Strait Islanders, and 1.9% of people identified as being of both Aboriginal and Torres Strait Islander descent.

The Indigenous population is much younger than the non-Indigenous population.

More than one-third (37%) of WA’s Indigenous population lived in the Perth metropolitan area, and 15% lived in the South-Western region.Slide3

Births and pregnancy outcome

In 2011, there were 2,506 births registered in WA with one or both parents identified as Indigenous (8% of all births registered).

In 2011, Indigenous mothers in WA were younger than non-Indigenous mothers; the median age was 24.2 years for Indigenous mothers and 30.3 years for all mothers.

In 2011, total fertility rates were 3,011 births per 1,000 for Indigenous women in WA and 1,953 per 1,000 for all women in WA. Slide4

In 2010, the average birthweight of babies born to Indigenous mothers living in WA was 3,139 grams compared with 3,353 grams for babies born to non-Indigenous mothers.

In 2010, the proportion of low

birthweight

babies born to Indigenous women in WA was twice that of non-Indigenous women (13.6% compared with 6.1%). Slide5

Indigenous mortalityIn 2006-2010, the age-

standardised

death rate for Indigenous people in WA was 2.5 times the rate for non-Indigenous people.

Between 1991 and 2010, there was a 35% reduction in the death rates for Indigenous people in WA.

For Indigenous people born 2005-2007 in WA, life expectancy was estimated to be 65.0 years for males and 70.4 years for females, around 14 and 12.5 years less than the estimates for non-Indigenous males and females, respectively. Slide6

In 2007-2011, age-specific death rates were higher for Indigenous people than for non-Indigenous people across all age-groups in WA, and were much higher in the middle adult years. For 2009-2011, the infant mortality rate was 2.4 times higher for Indigenous infants than that for non-Indigenous infants in WA.

For 2006 to 2010, the leading causes of death among Indigenous people in WA were cardiovascular disease, injury, and

neoplasms

(almost entirely cancers).

In 2006-2010, the age-adjusted rate of avoidable deaths for Indigenous people was 4.8 times higher than the rate for non-Indigenous people in WA. Slide7

Indigenous hospitalisationIn 2010-11, 7.4% of all hospitalisations

in WA were of Indigenous people.

In 2010-11, the age-

standardised

hospital separation rate for Indigenous people in WA was 3.8 times higher than that for other Western Australians.

In 2010-11, the main causes of

hospitalisation

for Indigenous people were for ‘care involving dialysis’ and injury.Slide8

Cardiovascular diseaseIn 2004-2005, 11% of Indigenous people in WA reported having a long-term heart or related condition.

In 2008-10, Indigenous people in WA were

hospitalised

for cardiovascular diseases at 1.9 times the rate of non-Indigenous people.

In 2006-2010, cardiovascular disease was the leading cause of death for Indigenous people in WA, accounting for 26% of Indigenous deaths.

In 2006-2010, the age-adjusted death rate for Indigenous people was 2.3 times the rate for non-Indigenous people in WA. Slide9

CancerIn 2007-2011, age-adjusted cancer incidence rates were similar for Indigenous people and non-Indigenous people in WA.

In 2007-2011, the most common cancers diagnosed among Indigenous people in WA were lung and breast cancer.

In 2008-10, age-

standardised

hospitalisation

rates for cancer were lower for Indigenous people than those for non-Indigenous people in WA.

In 2006-2010, the age-

standardised

death rate for all cancers for Indigenous people was 1.5 times higher than that for non-Indigenous people in WA. Slide10

Diabetes

In 2004-2005, 8.8% of Indigenous people in WA reported having diabetes; after age-adjustment, Indigenous people were 3.7 times more likely to report having some form of diabetes than were non-Indigenous people.

In 2008-10, age-adjusted

hospitalisation

rates for diabetes for Indigenous males and females were 4.4 and 6.2 times the rates of other males and females in WA, respectively.

In 2006-2010, Indigenous people in WA died from diabetes at 8.7 times the rate of non-Indigenous people. Slide11

Social and emotional wellbeing

In 2008, Indigenous people in WA experienced high to very high levels of psychological distress at almost three times the rate reported by non-Indigenous people.

In 2008, 92% of Indigenous people living in WA felt happy either some, most, or all of the time.

In 2000-2001, 24% of WA Indigenous children aged 4-17 years were at high risk of clinically significant emotional or

behavioural

difficulties; this compares with 15% of similarly aged children in the State’s general population.Slide12

In 2008-10, after age-adjustment, the hospitalisation rate for Indigenous males and females in WA with mental health-related conditions was 3.1 and 2.1 times the rates for their non-Indigenous counterparts, respectively.

In 2005-2009, the death rate for ICD ‘Intentional self-harm’ for Indigenous people living in WA was 3.1 times the rate for non-Indigenous people. Slide13

Kidney health

In 2008-2010, after age-adjustment, the notification rate of end stage renal disease was 11.7 times higher for Indigenous people than that for non-Indigenous people in WA.

In 2008-10, the age-adjusted

hospitalisation

rate for dialysis and chronic kidney disease were 15 times higher for Indigenous people than that non-Indigenous people living in WA.

In 2006-2010, the age-

standardised

death rate from kidney disease was 5.4 times higher for Indigenous people than that for non-Indigenous people in WA. Slide14

Injury

In 2008-10, after age-adjustment, Indigenous people were

hospitalised

for injury at 2.9 times the rate for non-Indigenous people in WA.

In 2006-2010, injury was the second most common cause of death among Indigenous people in WA, accounting for 18% of Indigenous deaths. Slide15

Respiratory disease

In 2004-2005, the overall levels of respiratory disease were similar for Indigenous and non-Indigenous people in WA.

In 2008-10, the age-

standardised

hospitalisation

rate for respiratory disease was 4.0 times higher for Indigenous people than that for non-Indigenous people in WA.

In 2006-2010, after age-adjustment, the death rate for Indigenous people was 2.9 times higher than that for non-Indigenous people in WA. Slide16

Eye health

In 2004-2005, eye and sight problems were reported by 29% of Indigenous people in WA.

In 2008, WA was the jurisdiction with the highest prevalence of low vision among Indigenous adults (12%) and the second highest prevalence among Indigenous children (1.9%).

In 2008-10,

hospitalisation

rates for diseases of the eye and

adnexa

were lower for Indigenous people than those for non-Indigenous people in WA.Slide17

Ear health

In 2008, 9.0% of Indigenous children in WA aged 0-14 years had ear/hearing problems.

In 2004-2005, prevalence of diseases of the ear and mastoid was higher among Indigenous children living in remote areas of WA (16% males and 12% females) than among those living in non-remote areas (9% males and 7% females).

In 2008-10, the age-adjusted

hospitalisation

rate for Indigenous people for disease of the ear and mastoid process was 1.5 times higher than the non-Indigenous rate in WA. Slide18

Oral health

In 2008, 28% of Indigenous children in WA had problems with their teeth or gums.

In 2004-2005, 77% of Indigenous adults in WA had lost fewer than five adult teeth.Slide19

Disability

In 2011, after age-adjustment, Indigenous people were more than twice as likely as non-Indigenous people in WA to have a profound/core activity restriction. Slide20

Communicable diseases

In 2009-2011, the age-

standardised

rate for hepatitis B notifications for Indigenous people in WA was almost three times, and the rate for hepatitis C notifications was four times, the rates reported for other people in WA.

In 1997-2007, the age-adjusted notification rate of invasive pneumococcal disease was 6.7 times higher for Indigenous people than that for non-Indigenous people in WA.

In 2011, the age-adjusted notification rate for

gonorrhoea

for Indigenous people living in WA was 44 times higher than the rate for non-Indigenous people.Slide21

In 2011, the age-adjusted notification rate for infectious syphilis for Indigenous people living in WA was 11 times the rate for non-Indigenous people.In 2011, the age-adjusted notification rate for chlamydia

for Indigenous people living in WA was almost four times higher than the rate for non-Indigenous people.

In 2011, there were 98 cases of newly diagnosed HIV infection in WA, of which five were identified as Indigenous.Slide22

Nutrition

In 2004-2005, the majority of Indigenous people in WA reported eating fruit (85%) and vegetables (94%) on a daily basis. Slide23

Physical activity

In 2008, 29% of Indigenous adults and 66% of Indigenous children living in WA took part in some type of physical activity or sport in the previous 12 months.

In 2004-2005, 71% of Indigenous adults in non-remote areas of WA reported sedentary or low levels of activity. Slide24

Bodyweight

In 2004-2005, the age-adjusted level of obesity/overweight was 1.3 times higher for Indigenous adults than that for non-Indigenous adults in WA. Slide25

Immunisation

In 2011, more than 80% of Indigenous children aged 0-5 years in WA were fully

immunised

against the recommended vaccine-preventable diseases.

In 2004-2005, 60% of Indigenous people aged 50 years or older in WA had been vaccinated against influenza in the previous year and 35% had been vaccinated against pneumonia in the previous five years.Slide26

Breastfeeding

In 2004-2005, 81% of Indigenous babies aged 0-3 years in non-remote areas of WA had been breastfed. Slide27

Tobacco smoking

In 2008, 44% of Indigenous adults in WA were current smokers.

In 2009, 51% of Indigenous mothers in WA reported smoking during pregnancy; this level was more than four times that of their non-Indigenous counterparts.Slide28

Alcohol use

In 2008, 34% of Indigenous adults abstained from alcohol.

In 2004-2005, there were similar levels of long-term risky/high risk alcohol use for Indigenous and non-Indigenous people in WA, but Indigenous people were twice as likely to report binge drinking on a weekly basis as non-Indigenous people.

In 2008-09, the

hospitalisation

rate for alcoholic liver disease was 9.3 times higher for Indigenous people than that for non-Indigenous people in WA.

In 2005-2009, the age-

standardised

death rate for alcohol-related deaths was 11 times higher for Indigenous people than that for non-Indigenous people in WA.Slide29

Illicit drug use

In 2008, 45% of Indigenous adults reported that they had ever used an illicit substance, and 25% reported that they had used an illicit substance in the previous 12 months.