/
Pa Mortality of Abomb Survivors in Nagasaki and Hirosh Pa Mortality of Abomb Survivors in Nagasaki and Hirosh

Pa Mortality of Abomb Survivors in Nagasaki and Hirosh - PDF document

pasty-toler
pasty-toler . @pasty-toler
Follow
403 views
Uploaded On 2015-04-21

Pa Mortality of Abomb Survivors in Nagasaki and Hirosh - PPT Presentation

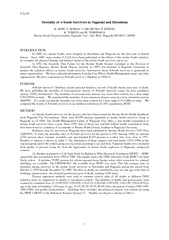
MINE S HONDA Y OKUMURA H KONDO K YOKOTA and M TOMONAGA Atomic Bomb Disease Institute Nagasaki Univ Sch Med Nagasaki 8528523 JAPAN INTRODUCTION In 1945 two atomic bombs were dropped on Hiroshima and Nagasaki for the first time in human history Since ID: 53147

MINE HONDA

Share:

Link:

Embed:

Download Presentation from below link

Download Pdf The PPT/PDF document "Pa Mortality of Abomb Survivors in Nagas..." is the property of its rightful owner. Permission is granted to download and print the materials on this web site for personal, non-commercial use only, and to display it on your personal computer provided you do not modify the materials and that you retain all copyright notices contained in the materials. By downloading content from our website, you accept the terms of this agreement.


Presentation Transcript

P-2a-59Mortality of A-bomb Survivors in Nagasaki and HiroshimaM. MINE, S. HONDA, Y. OKUMURA, H. KONDO,K. YOKOTA and M. TOMONAGAAtomic Bomb Disease Institute, Nagasaki Univ., Sch. Med., Nagasaki 852-8523, JAPANINTRODUCTIONIn 1945, two atomic bombs were dropped on Hiroshima and Nagasaki for the first time in humanhistory. Since 1945, many studies (1,2,3,4) have been performed on the effects of the atomic bomb radiation, P-2a-59 Table 1. Number of Subjects (Nagasaki University Survey)RadiationDose(Gy)MaleFemaleTotal 03,1595,0708,229 0.006-0.305409221,4620.31-0.401111392500.41-0.50691261950.51-1.001262143401.01-5.99207289496Total4,2126,76010,972 Table 2. Number of Subjects (Life Span Study by RERF)DS86shieldedkerma (Gy)HiroshimaNagasakiTotal 020,34613,92634,272 0.005-0.0512,7456,44719,1920.06-0.093,3767534,1290.10-0.194,3608125,1720.20-0.495,4071,1516,5580.50-0.992,9117053,6161.00-1.991,4225241,9462.00+8232831,106Total51,39024,60175,991 RESULTS(1) Nagasaki University study resulted in that males exposed to 0.31-0.40 Gy showed lower mortalityfrom non-cancerous diseases than that of control, which is statistically significant (p)Figure 1. Relative risk by radiation dose and sex (Non-cancerous disease).* : p(2) Table 3 shows the change in relative risks of mortality from all causes with increase in theradiation dose. It will be seen in the table that in male the risks of mortality for dose ranges, 0.06-0.09 and0.10-0.19Gy, are significantly lower than the control value for no adjusted city. But result of adjusted for cityshows no difference. Table 4 and Figure 2 shows the relative risk of mortality from non-cancerous disease. Therelative risk is significantly lower than controls for a dose range 0.06-0.49Gy adjusted for sex, age, and period(Figure 2A). But result of adjusted for city is no difference in the relative risk (Figure 2B). 01234 E Female * P-2a-59Table 3. Relative risks for death from all causes among atomic bomb survivors 1950-1985 by sex, dose range and period of follow-upRelative risk for various dose ranges (Gy) using DS86 dose estimates Number of death00.005- Total(1)28,7371.001.020.96+0.96+0.971.041.07*1.42* Total(2)1.001.030.980.980.991.07*1.09*1.44*Male(1)13,2571.001.000.92*0.91*0.951.001.031.29* Male(2)1.001.020.940.93+0.971.031.041.31Female(1)15,4801.001.030.991.000.981.08*1.14*1.59* Female(2)1.001.04+1.021.041.021.11*1.16*1.63*Period(1)1950-6511,8751.001.05*0.92*0.91*0.960.980.961.33* Period(2)1950-651.001.07*0.950.961.001.030.991.38*Period(1)1966-8516,8621.000.990.980.980.971.08*1.15*1.48* Period(2)1966-851.000.990.990.990.991.09*1.16*1.50* (1): adjusted for sex, age and period* : p p10(2): adjusted for city, sex, age and periodTable 4. Relative risks for death from non-cancerous diseases among atomic bomb survivors 1950-1985 by sex, dose range and period of follow-upRelative risk for various dose ranges (Gy) using DS86 dose estimates Number of death00.005- Total(1)20,7771.001.010.93*0.92*0.93*0.970.92+1.15* Total(2)1.001.020.970.960.971.010.941.19*Male(1) 9,3441.001.010.91*0.92*0.93+0.950.911.20* Male(2)1.001.030.940.950.960.990.931.23*Female(1)11,4331.001.010.950.94+0.93*0.990.941.12 Female(2)1.001.020.990.980.971.030.971.16Period(1)1950-65 8,8691.001.030.89*0.88*0.93+0.90*0.81*1.05 Period(2)1950-651.001.05+0.950.950.990.960.85*1.12Period(1)1966-8511,9081.000.990.960.950.93*1.031.001.23* Period(2)1966-851.000.990.980.970.941.051.011.25* (1): adjusted for sex, age and period* : p p10(2): adjusted for city, sex, age and period P-2a-59Figure 2. Relative risk by radiation dose (Non-cancerous disease). (A) Adjusted for sex, age and period (B) Adjusted for city, sex, age and periodDISCUSSIONFrom the analysis of LSS’s population, RERF, lower relative risk of mortality from non-cancerousdisease than control was observed for a dose range, 0.06-0.49Gy, when city was not adjusted. But when city wasadjusted, lower relative risk was not observed. Although the number of subjects analyzed in Nagasaki Universitywas smaller than that of LSS’s population, we have obtained the lower relative risk of mortality from non-cancerous disease for male at a range of low doses.ACKNOWLEDGEMENTSThis report makes use of data obtained from the Radiation Effects Research Foundation (RERF) inHiroshima, Japan. RERF is private foundation funded equally by the Japanese Ministry of Health and Welfareand the U.S. Department of Energy through the U.S. National Academy of Sciences. The conclusions in thisreport are those of the authors and do not necessarily reflect the scientific judgement of RERF or its fundingagencies. 01234 01234 P-2a-59REFERENCESG.W.Beebe, H.Kato and C.E.Land, Studies of the mortality of A-bomb survivors. 6. Mortality and radiationdose, 1950-74, Radiat. Res., 75, 138-201(1978).Y.Shimizu, H.Kato, W.J.Schull,D.L.Preston, S.Fujita and D.A.Pierce , Studies of the mortality of A-bombsurvivors. 9. Mortality . 1950-85:Part 1. Comparison of Risk Coefficients for Site-specific Cancer MortalityBased of the DS86 and T65DR Shielded Kerma and Organ dose, Radiat. Res., 118, 502-524(1989).Y.Shimizu, H.Kato, W.J.Schull and D.G.Hoel , Studies of the mortality of A-bomb survivors. 9. Mortality .1950-85:Part 3.Noncancer mortality based on the revised doses (DS86), Radiat. Res., 130 249-266(1992).D.A. Pierce, Y.Shimizu, D.L.Preston, M.Vaeth and K.Mabuchi, Studies of the mortality of atomic bombsurvivors. Report 12, Part 1 Cancer: 1950-1990, Radiat. Res., 146, 1-27(1996).H.Mori, M.Mine, H.Kondo and Y.Okumura, Medical Database for the Atomic-Bomb Survivors at NagasakiUniversity, Acta Medica Nagasaki, 37, 52-65(1992).M.Mine, Y.Okumura,, M.Ichimaru., T.Nakamura, and S.Kondo, Apparently beneficial effect of low tointermediate doses of A-bomb radiation on human lifespan, Int. J. Radiat. Biol., 58, 1035-1043(1990).SAS Institute Inc. SAS User's Guide: Statistics, Version 6, Fourth Edition, Cary, NC: SAS Institute (1990).