PPT-Take notes in your chart and label the diagram
Author : pasty-toler | Published Date : 2017-12-12
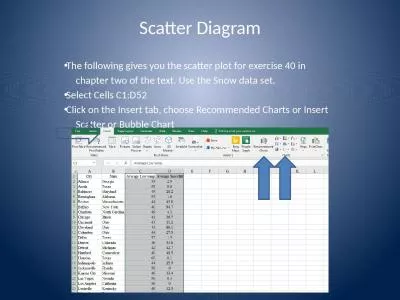
Muscles of the Body Biceps Brachii Flexes the Elbow Supinates the Forearm Triceps Brachii Extends the Elbow Pectoralis Major Adducts and Flexes Humerus Deltoid
Presentation Embed Code
Download Presentation
Download Presentation The PPT/PDF document "Take notes in your chart and label the d..." is the property of its rightful owner. Permission is granted to download and print the materials on this website for personal, non-commercial use only, and to display it on your personal computer provided you do not modify the materials and that you retain all copyright notices contained in the materials. By downloading content from our website, you accept the terms of this agreement.
Take notes in your chart and label the diagram: Transcript
Download Rules Of Document
"Take notes in your chart and label the diagram"The content belongs to its owner. You may download and print it for personal use, without modification, and keep all copyright notices. By downloading, you agree to these terms.
Related Documents