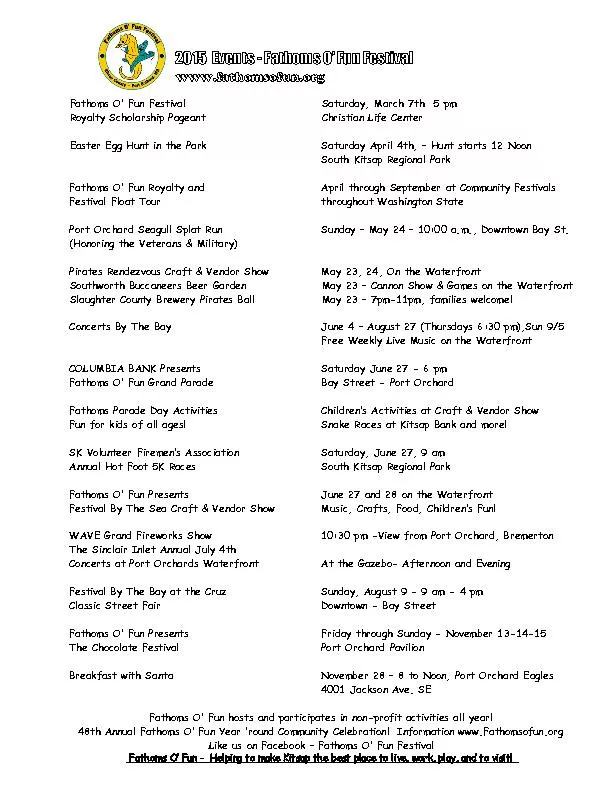
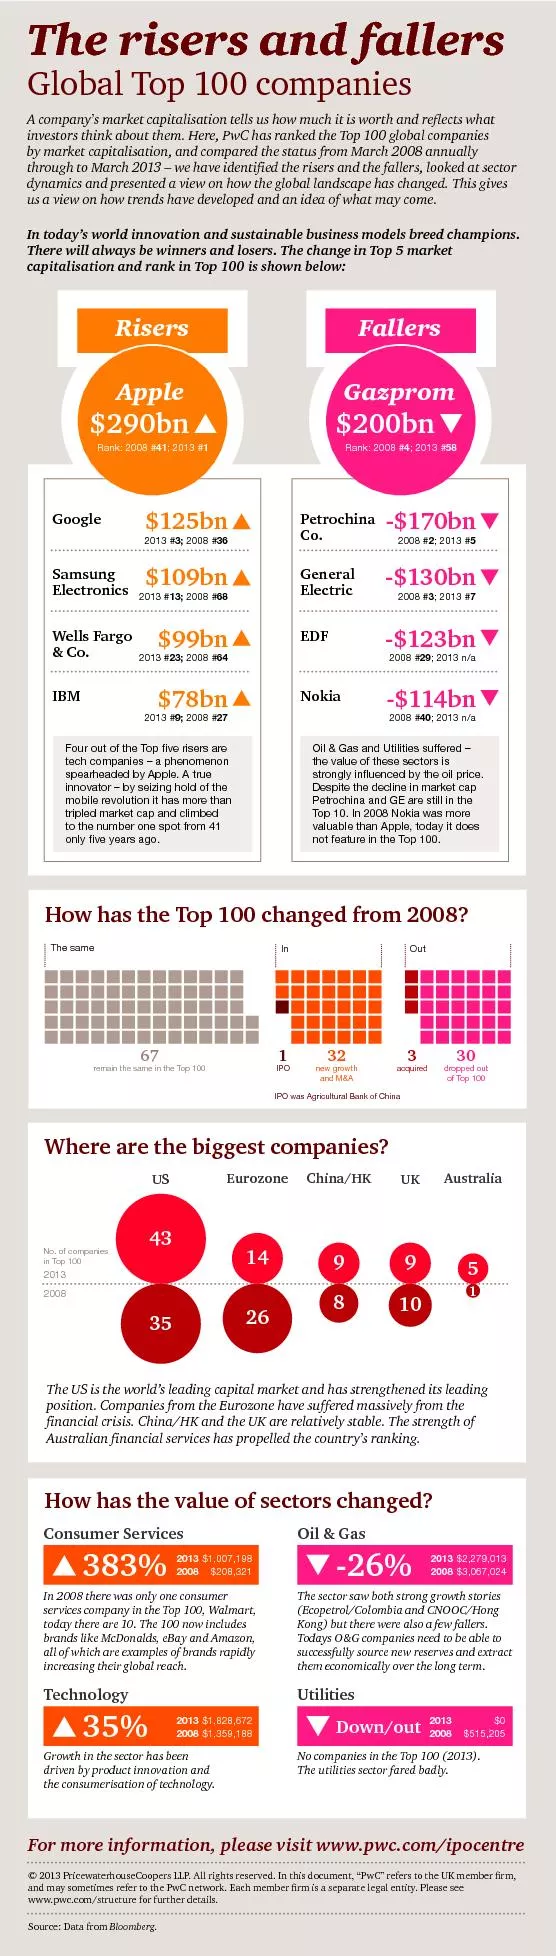
/
The risers and fallersGlobal Top 100 companiesA company’s marke The risers and fallersGlobal Top 100 companiesA company’s marke

The risers and fallersGlobal Top 100 companiesA company’s marke - PDF document

pasty-toler
pasty-toler . @pasty-toler
Follow
403 views
Uploaded On 2016-06-04

The risers and fallersGlobal Top 100 companiesA company’s marke - PPT Presentation

DownoutHow has the value of sectors changedConsumer Services UtilitiesTechnologyIn 2008 there was only one consumer services company in the Top 100 Walmart today there are 10 The 100 now includes ID: 347774

Down/outHow has the value

Share:

Link:

Embed:

Download Presentation from below link

Download Pdf The PPT/PDF document "The risers and fallersGlobal Top 100 com..." is the property of its rightful owner. Permission is granted to download and print the materials on this web site for personal, non-commercial use only, and to display it on your personal computer provided you do not modify the materials and that you retain all copyright notices contained in the materials. By downloading content from our website, you accept the terms of this agreement.


Presentation Transcript

The risers and fallersGlobal Top 100 companiesA company’s market capitalisation tells us how much it is worth and reflects what investors think about them. Here, PwC has ranked the Top 100 global companies by market capitalisation, and compared the status from March 2008 annually through to March 2013 – we have identified the risers and the fallers, looked at sector dynamics and presented a view on how the global landscape has changed. This gives us a view on how trends have developed and an idea of what may come.For more information, please visit www.pwc.com/ipocentre© 2013 PricewaterhouseCoopers LLP. All rights reserved. In this document, “PwC” refers to the UK member firm, Down/outHow has the value of sectors changed?Consumer Services UtilitiesTechnologyIn 2008 there was only one consumer services company in the Top 100, Walmart, today there are 10. The 100 now includes brands like McDonalds, eBay and Amazon, all of which are examples of brands rapidly increasing their global reach.The sector saw both strong growth stories (Ecopetrol/Colombia and CNOOC/Hong Kong) but there were also a few fallers. Todays O&G companies need to be able to successfully source new reserves and extract them economically over the long term.Growth in the sector has been driven by product innovation and the consumerisation of technology.No companies in the Top 100 (2013). The utilities sector fared badly. 2013 $1,007,1982008 $208,3212013 $1,828,672 $1,359,1882013 $0 RisersIn today’s world innovation and sustainable business models breed champions. There will always be winners and losers. The change in Top 5 market capitalisation and rank in Top 100 is shown below:GoogleApple Petrochina Four out of the Top five risers are mobile revolution it has more than to the number one spot from 41 FallersGazprom $200 Oil & Gas and Utilities suffered – strongly influenced by the oil price. Petrochina and GE are still in the Top 10. In 2008 Nokia was more not feature in the Top 100.ElectronicsGeneral ElectricWells Fargo Nokia 3; 2008 #36 13; 2008 #68 23; 2008 #64 9; 2008 #27 2008 #2; 2013 #5 2008 #3; 2013 #72008 #29; 2013 n/a 2008 #40; 2013 n/a How has the Top 100 changed from 2008? remain the same in the Top 100acquired The same in Top 100Australia 5 1UK 10 9China/HK 9 The US is the world’s leading capital market and has strengthened its leading position. Companies from the Eurozone have suffered massively from the financial crisis. China/HK and the UK are relatively stable. The strength of Australian financial services has propelled the country’s ranking. Where are the biggest companies? US Eurozone 26 14