PDF-Visualization of Interpenetration in TOPOS4.0 Professional
Author : pasty-toler | Published Date : 2016-04-30
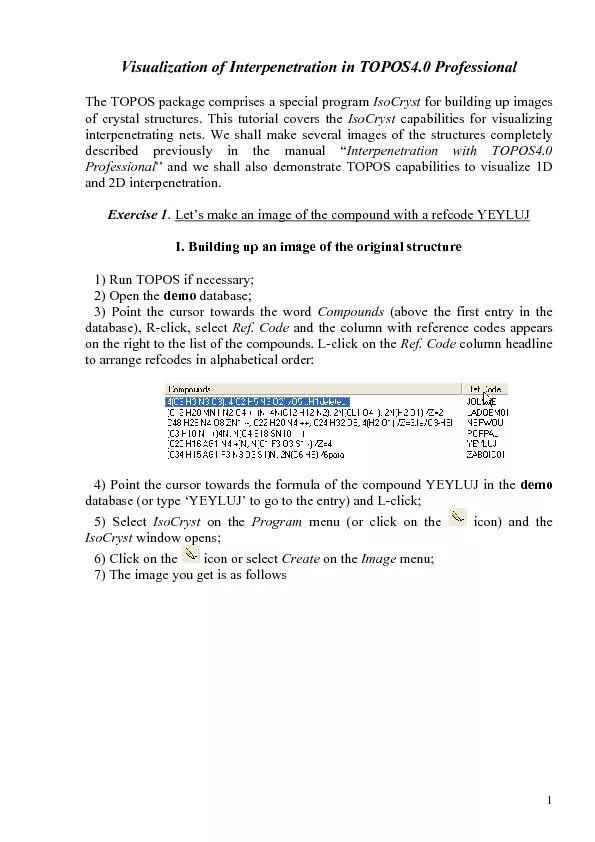
The TOPOS package comprises a special program IsoCryst for building up images of crystal structures This tutorial covers the Exercise 1 Let146s make an image of
Presentation Embed Code
Download Presentation
Download Presentation The PPT/PDF document "Visualization of Interpenetration in TOP..." is the property of its rightful owner. Permission is granted to download and print the materials on this website for personal, non-commercial use only, and to display it on your personal computer provided you do not modify the materials and that you retain all copyright notices contained in the materials. By downloading content from our website, you accept the terms of this agreement.
Visualization of Interpenetration in TOPOS4.0 Professional: Transcript
Download Rules Of Document
"Visualization of Interpenetration in TOPOS4.0 Professional"The content belongs to its owner. You may download and print it for personal use, without modification, and keep all copyright notices. By downloading, you agree to these terms.
Related Documents