/
Why Income and TRS are High in SR13 Why Income and TRS are High in SR13

Why Income and TRS are High in SR13 - PowerPoint Presentation

pasty-toler
pasty-toler . @pasty-toler
Follow
377 views
Uploaded On 2017-06-24

Why Income and TRS are High in SR13 - PPT Presentation

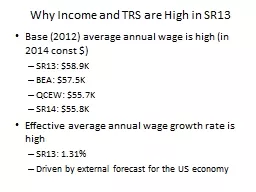
Base 2012 average annual wage is high in 2014 const SR13 589K BEA 575K QCEW 557K SR14 558K Effective average annual wage growth rate is high SR13 131 Driven by external forecast for the US economy ID: 562912

money income high trs income money trs high sr13 total taxable retail sales ratio forecast constant bea wage annual

Share:

Link:

Embed:

Download Presentation from below link

Download Presentation The PPT/PDF document "Why Income and TRS are High in SR13" is the property of its rightful owner. Permission is granted to download and print the materials on this web site for personal, non-commercial use only, and to display it on your personal computer provided you do not modify the materials and that you retain all copyright notices contained in the materials. By downloading content from our website, you accept the terms of this agreement.


Presentation Transcript

Slide1

Why Income and TRS are High in SR13

Base (2012) average annual wage is high (in 2014

const

$)

SR13: $58.9K

BEA: $57.5K

QCEW: $55.7K

SR14: $55.8K

Effective average annual wage growth rate is high

SR13: 1.31%

Driven by external forecast for the US economySlide2
Slide3
Slide4
Slide5

Why Income and TRS are High in SR13

TRS: Total Income is used as base

Includes non-money

rental value of owner-occupied

housing

interest on private pension plans, IRA and Keogh dividends

The ratio (TRS/Total Income) rises slightly

2012: 29%

2050: 33%Slide6

Income and Taxable Retail Sales

Total Income (BEA) vs Money Income (ACS, IRS)

For the forecast, we will derive money income via a set of multipliers tied to employment and population

[Money Income / Total Income] will be a constant ratio

Taxable retail sales: constant share of Money IncomeSlide7
Slide8

Does data on county-level taxable transactions by type of business (NAICS

) exist?

CA BOE shows state-wide only

Motor Vehicles and Parts: 17%

Food and Drink Service: 16%

Gasoline: 14%

General Merchandise: 13%

Closing 9%

Building Materials: 7%

Food Stores: 6%

Miscellaneous Retail: 5%

Other Combined: 14%