PDF-Correlation coefficient and values what they are and why you need to be very wary of them From Chapter of Risk Assessment a nd Decision Analysis with Bayesian Networks by Norman Fenton and Martin Ne
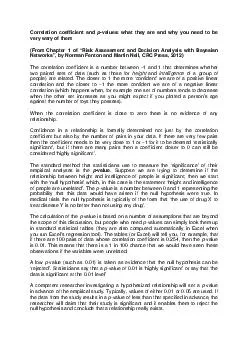
The closer to 1 the more confident we are of a positive linear correlation and the closer to 1 the more confident we are of a negative linear correlation which happens
Download Presentation
"Correlation coefficient and values what they are and why you " is the property of its rightful owner. Permission is granted to download and print materials on this website for personal, non-commercial use only, provided you retain all copyright notices. By downloading content from our website, you accept the terms of this agreement.
Presentation Transcript
Transcript not available.