/
Correlation Bivariate distribution: Correlation Bivariate distribution:

Correlation Bivariate distribution: - PowerPoint Presentation

byrne
byrne . @byrne
Follow
27 views
Uploaded On 2024-02-02

Correlation Bivariate distribution: - PPT Presentation

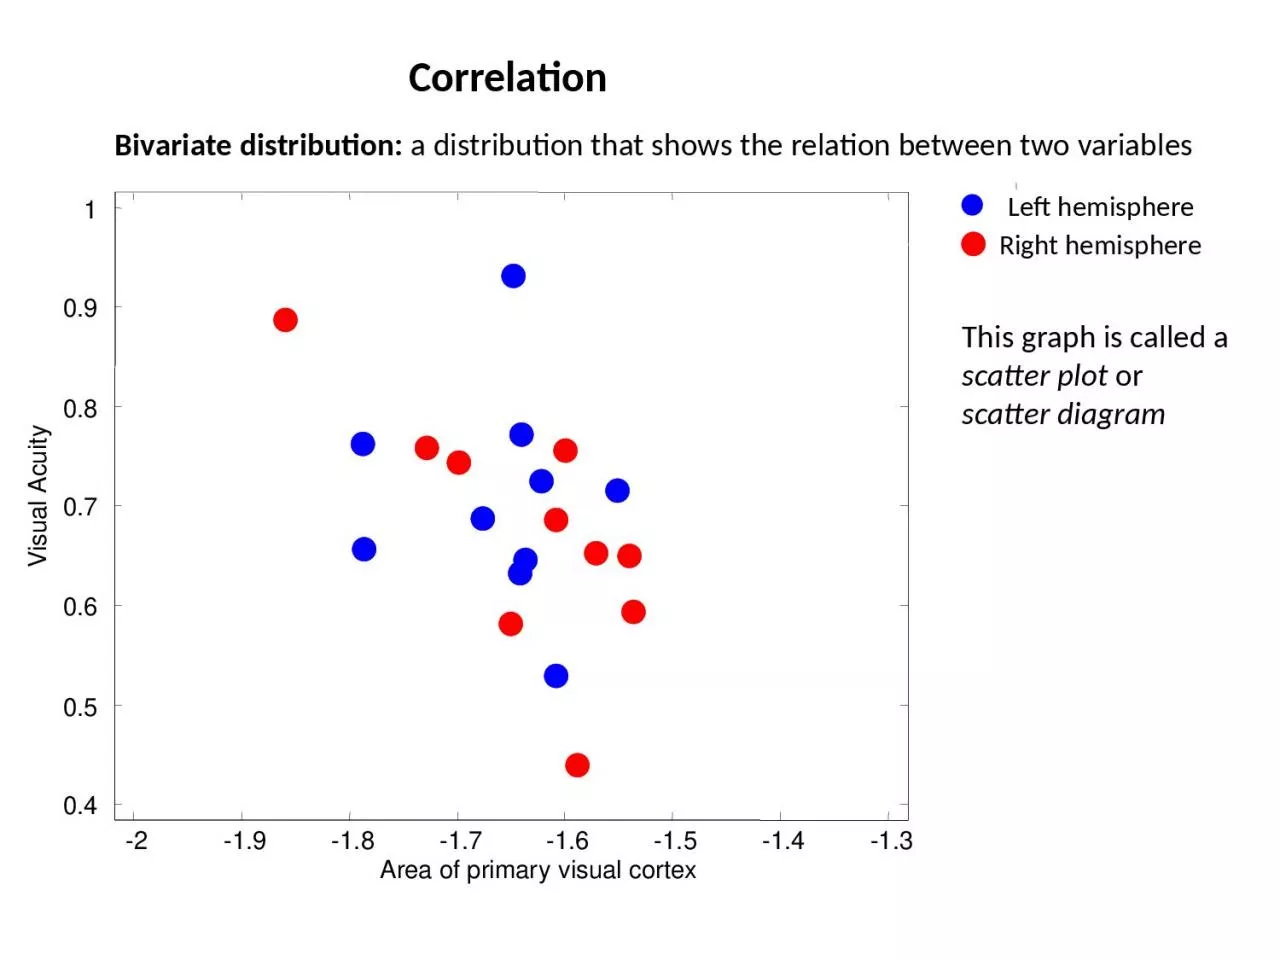
a distribution that shows the relation between two variables 2 19 18 17 16 15 14 13 04 05 06 07 08 09 1 Area of primary visual cortex Visual Acuity Left hemisphere ID: 1043529

formula correlation coefficient guess correlation formula guess coefficient score intuitive pearson 500 variables spearman practical calculating distribution difficultiesr rank

Share:

Link:

Embed:

Download Presentation from below link

Download Presentation The PPT/PDF document "Correlation Bivariate distribution:" is the property of its rightful owner. Permission is granted to download and print the materials on this web site for personal, non-commercial use only, and to display it on your personal computer provided you do not modify the materials and that you retain all copyright notices contained in the materials. By downloading content from our website, you accept the terms of this agreement.


Presentation Transcript

1. CorrelationBivariate distribution: a distribution that shows the relation between two variables-2-1.9-1.8-1.7-1.6-1.5-1.4-1.30.40.50.60.70.80.91Area of primary visual cortex Visual AcuityLeft hemisphereRight hemisphereThis graph is called a scatter plot or scatter diagram

2. How do we quantify the strength of the relationship between the two variables in a bivariate distribution?

3. How do we quantify the strength of the relationship between the two variables in a bivariate distribution?

4. Example:Two measures made for each subject – stress level and eating difficultiesStressE.D.1798138720181411712152215192630285101520253035510152025StressEating Difficulties

5. The most common way to quantify the relation between the two variables in a bivariate distribution is the Pearson correlation coefficient, labeled r. r is always between -1 and 1.The z-score formula is the most intuitive formula:179813872018141171215221519263028XY16.607.0213.308.28mx =sx =my =sy =zx zy zxzy0.06-0.52-0.03-1.23-0.040.04-1.23-0.760.930.480.570.27-0.37-0.280.10-1.37-1.482.030.63-1.00-0.630.770.210.160.341.530.521.911.773.396.68raw scoresz scoresExample: use the z-score formula to calculate r:

6. 179813872018141171215221519263028xy0.06-0.52-0.03-1.23-0.040.04-1.23-0.760.930.480.570.27-0.37-0.280.10-1.37-1.482.030.63-1.00-0.630.770.210.160.341.530.521.911.773.39zx zy zxzyHow does each data point contribute to the correlation value?30mxmyPoints in the upper right or lower left quadrants add to the correlation valuePoints in the upper left or lower right subtract to the correlation value.5101520253035510152025StressEating Difficultiesr = 0.68

7.

8.

9.

10. Fun fact about the Pearson correlation statisticSince the z-scores do not change when you add or multiply the raw scores, the Pearson correlation doesn’t change either. multiplying y by 2 and adding 100

11. Similarly, the correlation stays the same no matter how you stretch your axes:As a rule, you should plot your axes with an equal scale.102030510152025StressEating Difficultiesr = 0.6802040051015202530StressEating Difficultiesr = 0.68510152025300102030StressEating Difficultiesr = 0.68

12. Guess that correlation!

13. Guess that correlation!

14. Guess that correlation!

15. Guess that correlation!

16. Guess that correlation!

17. Guess that correlation!

18. Guess that correlation!

19. Guess that correlation!

20. 020406080100708090100110120130140xyr = -0.56Guess that correlation!

21. 102030405060105110115120125130135140145150xyr = 0.94Guess that correlation!

22. 102030405060708090100110120130140150160xyr = 0.08Guess that correlation!

23. -20-15-10-505135140145150155xyr = -1.00Guess that correlation!

24. -40-30-20-100102030408090100110120130140xyr = -0.08Guess that correlation!

25. -5005010080100120140160180200220240xyr = 0.49Guess that correlation!

26. -20-10010203040506070010203040506070xyr = -0.92Guess that correlation!

27. -40-200204060130140150160170180190200210220xyr = -0.77Guess that correlation!

28. r is a measure of the linear relation between two variables-2-101200.511.522.533.54xyr = 0.01

29. -1.5-1-0.500.511.5-1-0.500.51xyr = 0.00Guess that correlation!

30. -1-0.500.51-1-0.8-0.6-0.4-0.200.20.40.60.81xyr = 0.91Guess that correlation!

31. Z-Score formula for calculating r (intuitive, but not very practical)Deviation-Score formula for calculating r: (somewhat intuitive, somewhat more practical)Substituting the formula for z:Computational formula for calculating r: (less intuitive, more practical)

32. Computational formula for calculating r: (less intuitive, more practical)A little algebra shows that:Computational raw score formula for calculating r: (least intuitive, most practical)

33.

34. Using the Computational raw-score formula:nXYX2Y2XY1017928981153813641691048764495620184003243601411196121154724941421544125105221548422533019263616764943028900784840Totals166134324824582610SSX492.4SSy662.4r0.675

35. A second measure of correlation, called the Spearman Rank-Order Coefficient is appropriate for ordinal scores. It is calculated by:Where D is the difference between each pair of ranks.Most often used when:At least one variable is an ordinal scaleOne of the distributions is very skewed or has outliers

36. Fact: (According to Wikipedia anyway)In 1995, National Pax had planned to replace the "Sir Isaac Lime" flavor with "Scarlett O'Cherry," until a group of Orange County, California fourth-graders created a petition in opposition and picketed the company's headquarters in early 1996. The crusade also included an e-mail campaign, in which a Stanford professor reportedly accused the company of "Otter-cide." After meeting with the children, company executives relented and retained the Sir Isaac Lime flavor.[1]Example: Is there a correlation between your preference for Otter Pops® flavors and mine?

37.

38. Example: Suppose two wine experts were asked to rank-order their preference for eight wines. How can we measure the similarity of their rankings? XYRank XRank YDD21212-112121113535-244343115454116767-117878-11868624n=814

39. Pearson correlation is much more sensitive to outlying values than the Spearman coefficient.From: http://en.wikipedia.org/wiki/Spearman%27s_rank_correlation_coefficient

40. Pearson correlation is more sensitive to outlying values than the Spearman coefficient.

41. Only the rank order matters for the Spearman coefficient -0.500.5-0.500.51XYPearson r: 0.92Spearman r s: 1.00