PDF-Data Plotting and Curve Fitting in MATLAB Curve Fitting Get the file pwl.dat from the class web page. This is an ASCII text file containing two columns of numbers representing the and coordinates of a dataset. From MATLAB, type ...
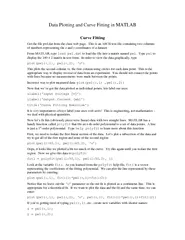
Now find fit parameters for the second half of the dataset and plot the data with both fits together You might want to adjust the axes to zoom in on the data Finally
Download Presentation
"Data Plotting and Curve Fitting in MATLAB Curve Fitting Get " is the property of its rightful owner. Permission is granted to download and print materials on this website for personal, non-commercial use only, provided you retain all copyright notices. By downloading content from our website, you accept the terms of this agreement. Download
Presentation Transcript
Transcript not available.