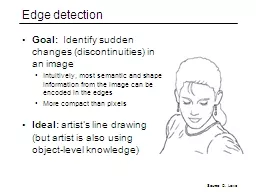
Goal Identify sudden changes discontinuities in an image Intuitively most semantic and shape information from the image can be encoded in the edges More compact than pixels Ideal artists line drawing but artist is also using objectlevel knowledge ID: 261965
Download Presentation The PPT/PDF document "Edge detection" is the property of its rightful owner. Permission is granted to download and print the materials on this web site for personal, non-commercial use only, and to display it on your personal computer provided you do not modify the materials and that you retain all copyright notices contained in the materials. By downloading content from our website, you accept the terms of this agreement.
Slide1
Edge detection
Goal:
Identify sudden changes (discontinuities) in an imageIntuitively, most semantic and shape information from the image can be encoded in the edgesMore compact than pixelsIdeal: artist’s line drawing (but artist is also using object-level knowledge)
Source: D. LoweSlide2
Origin of edges
Edges are caused by a variety of factors:
depth discontinuity
surface color discontinuity
illumination discontinuity
surface normal discontinuity
Source: Steve SeitzSlide3
Characterizing edges
An edge is a place of rapid change in the image intensity function
image
intensity function
(along horizontal scanline)
first derivative
edges correspond to
extrema of derivativeSlide4
Derivatives with convolution
For 2D function
f(x,y), the partial derivative is:For discrete data, we can approximate using finite differences:
To implement above as convolution, what would be the associated filter?
Source:
K.
GraumanSlide5
Partial derivatives of an image
Which shows changes with respect to x?
-1 1
1 -1
or
-1 1Slide6
Finite difference filters
Other approximations of derivative filters exist:
Source: K. GraumanSlide7
The gradient points in the direction of most rapid increase in intensity
Image gradient
The gradient of an image:
The gradient direction is given by
Source: Steve Seitz
The
edge strength
is given by the gradient magnitude
How does this direction relate to the direction of the edge?Slide8
Effects of noise
Consider a single row or column of the imagePlotting intensity as a function of position gives a signal
Where is the edge?
Source: S. SeitzSlide9
Solution: smooth first
To find edges, look for peaks in
f
g
f * g
Source: S. SeitzSlide10
Differentiation is convolution, and convolution is associative:
This saves us one operation:
Derivative theorem of convolution
f
Source: S. SeitzSlide11
Derivative of Gaussian filter
Are these filters separable?
x
-direction
y
-directionSlide12
Derivative of Gaussian filter
Which one finds horizontal/vertical edges?
x
-direction
y
-directionSlide13
Smoothed derivative removes noise, but blurs edge. Also finds edges at different “scales”
1 pixel
3 pixels
7 pixels
Scale of Gaussian derivative filter
Source: D. ForsythSlide14
Review: Smoothing vs. derivative filters
Smoothing filters
Gaussian: remove “high-frequency” components; “low-pass” filterCan the values of a smoothing filter be negative?What should the values sum to?One: constant regions are not affected by the filter
Derivative filters
Derivatives of Gaussian
Can the values of a derivative filter be negative?
What should the values sum to
?
Zero:
n
o response in constant regions
High absolute value at points of high contrastSlide15
The Canny edge detector
original image
Slide credit: Steve SeitzSlide16
The Canny edge detector
norm of the gradientSlide17
The Canny edge detector
thresholdingSlide18
The Canny edge detector
thresholding
How to turn these thick regions of the gradient into curves?Slide19
Non-maximum suppression
Check if pixel is local maximum along gradient direction, select single max across width of the edge
requires checking interpolated pixels p and rSlide20
The Canny edge detector
thinning
(non-maximum suppression)
Problem: pixels along this edge didn’t survive the
thresholdingSlide21
Hysteresis thresholding
Use a high threshold to start edge curves, and a low threshold to continue them.
Source:
Steve
SeitzSlide22
Hysteresis thresholding
original image
high threshold
(strong edges)
low threshold
(weak edges)
hysteresis threshold
Source: L.
Fei-FeiSlide23
Recap: Canny edge detector
Filter image with derivative of Gaussian
Find magnitude and orientation of gradientNon-maximum suppression:Thin wide “ridges” down to single pixel widthLinking and
thresholding
(
hysteresis
):
Define two thresholds: low and high
Use the high threshold to start edge curves and the low threshold to continue them
MATLAB:
edge(image, ‘canny’);
J. Canny,
A Computational Approach To Edge Detection
, IEEE Trans. Pattern Analysis and Machine Intelligence, 8:679-714, 1986. Slide24
Edge detection is just the beginning…
Berkeley segmentation database:
http://www.eecs.berkeley.edu/Research/Projects/CS/vision/grouping/segbench/
image
human segmentation
gradient magnitudeSlide25
Background
Texture
Shadows
Low-level edges vs. perceived contours
Kristen Grauman, UT-Austin