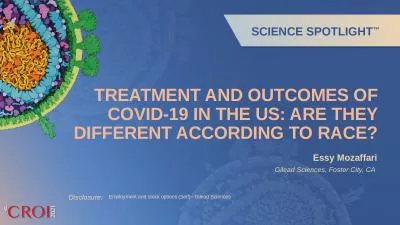
/
Gilead Sciences, Inc., Foster City, CA, USA Gilead Sciences, Inc., Foster City, CA, USA

Gilead Sciences, Inc., Foster City, CA, USA - PowerPoint Presentation

phoebe-click
phoebe-click . @phoebe-click
Follow
343 views
Uploaded On 2019-11-22

Gilead Sciences, Inc., Foster City, CA, USA - PPT Presentation

Gilead Sciences Inc Foster City CA USA FTCTDF Truvada for HIV PreExposure Prophylaxis PrEP Utilization in the United States 20122015 Robertino Mera Scott McCallister Brian Palmer ID: 766919

ftc tdf 2015 prep tdf ftc prep 2015 hiv 2012 risk women men individuals rates diagnosis 2016 100 msm

Share:

Link:

Embed:

Download Presentation from below link

Download Presentation The PPT/PDF document "Gilead Sciences, Inc., Foster City, CA, ..." is the property of its rightful owner. Permission is granted to download and print the materials on this web site for personal, non-commercial use only, and to display it on your personal computer provided you do not modify the materials and that you retain all copyright notices contained in the materials. By downloading content from our website, you accept the terms of this agreement.


Presentation Transcript

Gilead Sciences, Inc., Foster City, CA, USA FTC/TDF (Truvada) for HIV Pre-Exposure Prophylaxis (PrEP) Utilization in the United States: 2012−2015 Robertino Mera , Scott McCallister , Brian Palmer, Gal Mayer, David Magnuson, M. Keith Rawlings

DisclosuresAll authors are employees and shareholders of Gilead Sciences2

BackgroundIn 2012 FTC/TDF (Truvada) was licensed in the United States for pre-exposure prophylaxis (PrEP) to reduce the risk of sexually acquired HIV-1 for adults at high risk of infectionCenters for Disease Control (CDC) estimates that an individual living in the US has a 1 in 99 chance of HIV infection during their lifetime*Lifetime risk by race/ethnicity and gender: Black men, 1 in 20; Black women, 1 in 48Hispanic men, 1 in 48; Hispanic women, 1 in 227White men, 1 in 132; White women, 1 in 880Lifetime risk for men who have sex with men (MSMs)Black MSM, 1 in 2Hispanic MSM, 1 in 4White MSM, 1 in 11 *CDC, 23 Feb 2016.3

Lifetime Risk of HIV Diagnosis in the USSource: CDC 23 Feb 2016.4 Northeast South Midwest West Highest Risk (1/13—1/97) (1/98—1/159) (1/167—1/264) Lowest Risk (1/302—1/578) State 1/n District of Columbia 13 Maryland 49 Georgia 51 Florida 54 Louisiana 56 New York 69 Texas 81 New Jersey 84 Mississippi 85 South Carolina 86 North Carolina 93 Delaware 96 Alabama 97

Seroconversion Rates in Clinical Studies of FTC/TDF for PrEPHIV-1 seroconversion rates for participants on FTC/TDF for PrEP are variable in clinical studies (0.5 to 4.7 per 100 person-years exposure)*FTC/TDF only. TGW, transgender womenSeroconversion rate/100 person-yearsIPERGAYPROUDIPREX Partner’s PrEP* TDF2 FemPrEP MTN003/ VOICE* MSM MSM MSM, TGW Discord Hetero Couples Hetero Men & Women Women Women France Canada UK S. America Africa USA AfricaBotswanaAfricaAfrica Molina NEJM 2015;373:2237-46; McCormack Lancet 2016;387:53-60; Grant NEJM 2010;363:2587-99; Baeten NEJM 2012;367:399-410; Thigpen NEJM 2012;367:423-34; Peterson PLoS Clin Trials 2007;2:e27; Marrazzo NEJM 2015;372:509-18.

In 32 Demonstration Projects, Seroconversion Rates were Consistent with Clinical Studies32 individual studies of FTC/TDF for PrEP8,478 participants7,002 men; 1,388 women; 76 transgender women7,061 cumulative person-years of FTC/TDF exposureResults67 HIV-1 seroconversions 0.95/100 p-y seroconversion rate(95% CI: 0.74, 1.21)McCallister, ASM Microbe 2016, Abs 371LB6 0.1–1.5/ 100 p-y 9 projects Seroconversion Rates From 32 Projects >1.5/ 100 p-y 6 projects 0/100 p-y 17 projects

32 FTC/TDF PrEP Demonstration ProjectsSeroconversion Rates By Sex/Gender*Includes genderqueer, androgynous designations. McCallister, ASM Microbe 2016, Abs 371LB.7Menn=7002Womenn=1388 Transgender Women*n=76 Total exposure, p-y 6214 788 48 Number of HIV-1 seroconversions 64 2 1 Rate/100 p-y (95% CI) 1.03 (0.80-1.32) 0.25 (0.03-0.92) 2.07 (0.05-11.52)

MethodsNational, electronic, patient-level prescription data was collected from 80% of US retail pharmacies that dispensed FTC/TDF between January 2012 and December 2015All patient-level prescription data were de-identified and linked to confirmatory data from a de-identified medical insurance claims database A validated algorithm was then used to filter out non-PrEP prescriptions 8

Algorithm to Quantify FTC/TDF Use for PrEPAll medical diagnosis codes where FTC/TDF was prescribed were evaluated; other possible uses of FTC/TDF were excludedBush S, ASM Microbe 2016, Abstract 26519HIVHBVPEP Exclude all concomitant use of any other antiretroviral treatment. Exclude anti chronic hepatitis B specific treatment Exclude specific codes of E920.5 (contaminated needle stick) and /or V078 V079 (prophylaxis). Exclude a prior diagnosis of HIV disease (ICD9 = 042); asymptomatic HIV infection (V08); HIV-2 infection (079.53) or nonspecific serologic evidence of HIV (795.71)  Exclude a prior diagnosis of chronic hepatitis B infection (70.22, 70.23, 70.32, 70.33). Exclude a prior diagnosis of opportunistic infection:(Candidiasis of bronchi, trachea, esophagus 112.84, or lungs 112.4, Toxoplasmosis 130.X, Coccidioidomycosis 114, Cryptococcosis 117.5, Cryptosporidiosis 007.4, CMV retinitis 078.5, Kaposi's sarcoma 176.0, Mycobacterium avium complex 031.2 031.0, Pneumocystis carinii pneumonia 136.3)

Unique Individuals Starting FTC/TDF for PrEP in US,2012 to 2015 (by quarter)102015 2014 2013 2012 2012 2013 2014 2015 79,684 unique individuals started FTC/TDF for PrEP: 1,671 in Q4 2012 → 14,000 in Q4 2015 738% increase

Men and Women Starting FTC/TDF for PrEP in US, 2012 to 2015114-YearTotal: 79,684 6,210 Women: 18,812 Men: 60,872 9,023 21,906 42,545

60,872 Men18,812 WomenAge of Individuals Starting FTC/TDF for PrEP in US 2012-2015Mean age of 79,684 unique individuals: 36.2 years12Mean age, y 37.1 2012 39.2 2015 36.7 <25 years ≥ 25 years Mean age, y 33.2 2012 34.0 2015 33.4

Region and State Use of FTC/TDF for PrEP2012-2015SouthNortheastMidwestWestTX6.8%NY15.9%IL 5.4%CA 16.7%FL 5.7% MA 5.1% MN 2.5% WA 3.5% GA 3.7% PA 4.7% OH 2.1% AZ 1.8% DC3.3%NJ2.5%MO1.2% CO1.5%NC1.7%CT0.8%MI1.2%OR1.2%MD1.5%RI0.5%IN1.0% NV0.6%VA1.2%NH0.2%WI0.6%UT0.5% TN1.0%ME0.2%KS0.5%NM0.4%LA0.9%VT 0.1%IA0.3%HI0.2%AL0.5%NE0.2%ID0.2%SC0.4%ND0.1%MT0.1% KY0.4%SD0.0%WY0.1%OK0.4%AK0.0%MS0.3%DE0.3% AR0.2%WV0.1%CA, NY, TX, FL, & IL account for 50.5% of unique individuals starting FTC/TDF for PrEP 13

US States with Highest Rates of FTC/TDF for PrEP 2012-2015*US Census Bureau population estimate, 1 July 2015.14StateNumber of individuals startingState population** Percent of population starting (%) Massachusetts 4,950 6,794,422 0.073 New York 12,588 19,795,791 0.064 Illinois 4,302 12,859,995 0.033 Florida 5,675 20,271,272 0.028 California 10,437 39,144,818 0.027New Jersey2,301 8,958,0130.026Pennsylvania2,87812,802,5030.022 Georgia2,23010,214,8600.022Texas5,12027,469,1140.019 Ohio2,15611,613,4230.019

Top 20 US Cities with FTC/TDF for PrEP Use in 2015 (January to December) 15 Total Number of Individuals P rescribed FTC/TDF for PrEP in 2015 West San Francisco, CA 1094 Los Angeles, CA 660 Seattle, WA 574 San Diego, CA 279 Beverly Hills, CA 218 Denver, CO 202 Phoenix, AZ 186 Portland, OR 186 Midwest Chicago, IL 1001 Minneapolis, MN 378 Northeast New York, NY 2936 Boston, MA 548 Philadelphia, PA 500 Bronx, NY 169 South Washington, DC 840 Atlanta, GA 524 Houston, TX 388 Dallas, TX 400 Austin, TX 286 Orlando, FL 168 2015 accounts for 39-55% of starts in each city

SummaryThe number of unique individuals starting FTC/TDF for PrEP has increased annually since the approval in the US79,684 through end of 2015, a 738% increase from 2012 to 2015Highest rates of FTC/TDF for PrEP use are in men (76.4%) and in those age 25 and up (85.0%)Massachusetts, New York, Illinois have highest rates of FTC/TDF for PrEP use (per population), while some states with highest lifetime risk of HIV diagnosis still have lower numbers on FTC/TDF for PrEPDespite this US trend of increasing use of FTC/TDF for PrEP, barriers should be addressed in those at high risk of HIV acquisition: Women, individuals <25 years, states with historically high infection rates16

AcknowledgmentsNational Prescription DatabaseIMS Health, CT, USASymphony Health Solutions, AZ, USAStatistical analysesGilead Sciences Department of Drug Safety and Public Health17

Backup

Lifetime Risk of HIV Diagnosis in the USSource: CDC. Lifetime risk of HIV diagnosis February 23, 2016.19Highest Risk Lowest Risk State 1/n State 1/n State 1/n State 1/n District of Columbia 13 Nevada 98 Michigan 167 West Virginia 302 Maryland 49 Illinois 101Oklahoma168Wisconsin 307Georgia51California102Kentucky173Iowa 342Florida54Tennessee103Indiana183Utah366Louisiana56Pennsylvania 115Washington 185Maine373New York69 Virginia115Colorado191Alaska384Texas 81Massachusetts121New Mexico 196 South Dakota402New Jersey 84Arizona 138Hawaii202New Hampshire 411Mississippi85Connecticut139Oregon214Wyoming 481South Carolina86Rhode Island143 Minnesota216Vermont527 North Carolina93Ohio150Kansas 262Idaho547Delaware96Missouri155Nebraska 264Montana578 Alabama 97 Arkansas159 Northeast South Midwest West