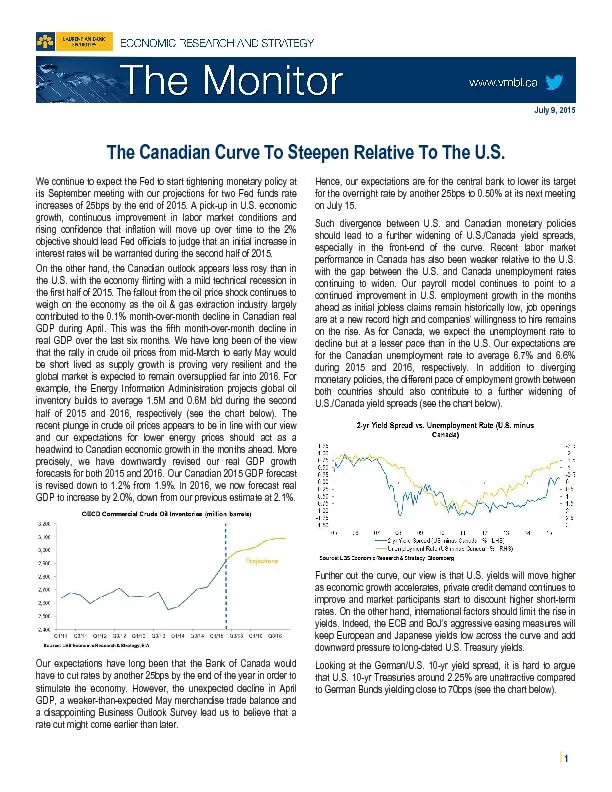
/
We continue to expect the Fed to start tightening monetary policy at i We continue to expect the Fed to start tightening monetary policy at i

We continue to expect the Fed to start tightening monetary policy at i - PDF document

phoebe-click
phoebe-click . @phoebe-click
Follow
431 views
Uploaded On 2016-08-07

We continue to expect the Fed to start tightening monetary policy at i - PPT Presentation

July 9 2015 9 2015 The same argument can be raised for Japanese government bonds which are yielding close to 45bps Adding to that an environment favorable to the appreciation of the US Dollar s ID: 436639

July 2015 9 2015 The same

Share:

Link:

Embed:

Download Presentation from below link

Download Pdf The PPT/PDF document "We continue to expect the Fed to start t..." is the property of its rightful owner. Permission is granted to download and print the materials on this web site for personal, non-commercial use only, and to display it on your personal computer provided you do not modify the materials and that you retain all copyright notices contained in the materials. By downloading content from our website, you accept the terms of this agreement.


Presentation Transcript

July 9, 2015 We continue to expect the Fed to start tightening monetary policy at its September meeting with our projections for two Fed funds rate increases of 25bps by the end of 2015. A pick-up in U.S. economic 9, 2015 The same argument can be raised for Japanese government bonds, which are yielding close to 45bps. Adding to that an environment favorable to the appreciation of the U.S. Dollar, such wide spreads should lead to a rise in demand for U.S. Treasuries and result in downward pressure on U.S. rates. Our expectations are for the U.S. 10-year yield to climb to 2.60% by the end of 2015. As for the long-end of the Canadian curve, future moves in yields will largely be in sympathy with developments in Europe and the U.S. Further widening of U.S./Canada yield spreads in the 10-year sector should be limited with the yield differential already trading close to its widest in more than fifteen years (see the chart below). Our expectations are for the Canadian 10-year yield to rise to 2.10% by the end of 2015. Trade RecommendationThe bottom line is that the Fed should start tightening its monetary policy during the second half of 2015, while the Bank of Canada will be forced back into easing in order to stimulate an economy still negatively impacted by the oil price shock. Diverging monetary policies combined with our expectations for the Canadian 10-year yield to largely move in tandem with its U.S. counterpart over the next few months should lead the Canadian curve to steepen relative to the U.S. The current rise in the gap between the Canadian and U.S. misery indices also appears to reinforce our view as an increasing spread historically tended to coincide with a relative steepening of the Canadian curve (see the chart below). The misery index is an economic indicator that is found by adding the unemployment rate to the inflation rate of a country. In other words, our relatively more optimistic outlook on the U.S. economy should lead the Canadian curve to steepen relative to the U.S. Eric Corbeil, M.Sc., CFA Senior Economist 514 350-2925 | 9, 2015 North American Forecasts _______________________________________________________________ This document is intended only to convey information. It is not to be construed as an investment guide or as an offer or solicitation of an offer to buy or sell any of the securities mentioned in it. The author is an employee of Laurentian Bank Securities (LBS), a wholly owned subsidiary of the Laurentian Bank of Canada. The author has taken all usual and reasonable precautions to determine that the information contained in this document has been obtained from sources believed to be reliable and that the procedures used to summarize and analyze it are based on accepted practices and principles. However, the market forces underlying investment value are subject to evolve suddenly and dramatically. Consequently, neither the author nor LBS can make any warranty as to the accuracy or completeness of information, analysis or views contained in this document or their usefulness or suitability in any particular circumstance. You should not make any investment or undertake any portfolio assessment or other transaction on the basis of this document, but should first consult your Investment Advisor, who can assess the relevant factors of any proposed investment or transaction. LBS and the author accept no liability of whatsoever kind for any damages incurred as a result of the use of this document or of its contents in contravention of this notice. This report, the information, opinions or conclusions, in whole or in part, may not be reproduced, distributed, published or referred to in any manner whatsoever without in each case the prior express written consent of Laurentian Bank Securities. 13Q213Q313Q414Q114Q214Q314Q415Q115Q215Q315Q416Q116Q216Q316Q4CanadaOvernight Rate Target1.001.001.001.001.001.001.000.750.750.500.500.500.500.500.50 3-Month Treasury Bills1.000.970.910.950.941.000.910.550.580.450.400.450.450.450.50 2-Year Bond1.221.191.131.011.101.101.010.510.490.450.400.450.600.700.75 5-Year Bond1.801.861.951.711.531.601.340.770.810.951.201.251.351.501.60 10-Year Bond2.442.542.772.462.242.101.791.361.681.752.102.152.302.452.60 30-Year Bond2.903.073.242.972.782.652.301.982.312.452.702.802.903.003.90United StatesFederal Funds Rate Target**0.130.130.250.250.250.250.250.250.250.500.751.251.501.501.75 3-Month Treasury Bills0.040.010.070.050.040.020.040.030.010.750.601.251.501.451.70 2-Year Bond0.360.320.390.440.470.580.670.560.641.751.251.402.002.101.85 5-Year Bond1.411.421.751.731.621.781.651.371.631.952.102.252.552.702.75 10-Year Bond2.522.613.042.732.532.522.171.942.352.502.602.702.853.053.25 30-Year Bond3.683.693.963.563.343.212.752.543.113.203.253.353.503.653.80Canadian Dollar (US$/C$)0.950.970.940.900.940.890.860.790.800.750.820.830.840.850.85Euro (US$/Euro)1.301.351.371.381.351.261.211.071.11---1.00---------1.00S&P 500 Index160616821848187219601972205920682063---2200---------2300TSX Index121291278713622143351514614961146321490214553---16000---------17500Oil WTI (US$/barrel)93.5102.398.2101.6106.191.253.348605375.0---------85.0Quarter-end data and annual averages Updated: July 2015 * upper bound of the target range for the Fed fundsFinancial Forecasts