/
Science of Soda Pop Fall 2012 Science of Soda Pop Fall 2012

Science of Soda Pop Fall 2012 - PowerPoint Presentation

relylancome
relylancome . @relylancome
Follow
343 views
Uploaded On 2020-08-28

Science of Soda Pop Fall 2012 - PPT Presentation

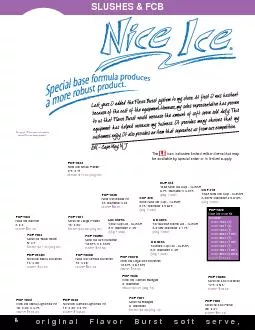
A Look at graph showing availability of soft drinks B Look at graph comparing soda consumption between different countries II What is in a soda Regular Coke Diet Coke Regular Sprite Diet Sprite ID: 808480

coke soda water glucose soda coke glucose water density diet sugar regular sugars fructose mass test acidic place testing

Share:

Link:

Embed:

Download Presentation from below link

Download The PPT/PDF document "Science of Soda Pop Fall 2012" is the property of its rightful owner. Permission is granted to download and print the materials on this web site for personal, non-commercial use only, and to display it on your personal computer provided you do not modify the materials and that you retain all copyright notices contained in the materials. By downloading content from our website, you accept the terms of this agreement.


Presentation Transcript

Slide1

Science of Soda Pop

Fall 2012

Slide2

A. Look at graph showing availability of soft drinks.

Slide3

B. Look at graph comparing soda consumption between different countries.

Slide4

II. What is in a soda?

Regular Coke

Diet Coke

Regular Sprite

Diet Sprite

Fat

Fat

FatFatProteinProteinProteinProteinFiberFiberFiberFiberSodiumSodiumSodiumSodiumCarbohydratesCarbohydratesCarbohydratesCarbohydratesSugarsSugarsSugarsSugarsVitaminsVitaminsVitaminsVitaminsCalciumCalciumCalciumCalciumCarbonated WaterCarbonated WaterCarbonated WaterCarbonated WaterHFCSHFCSHFCSHFCSPhosphoric AcidPhosphoric AcidPhosphoric AcidPhosphoric AcidCitric AcidCitric AcidCitric AcidCitric Acid

Essentially, there is very little nutritional value found in sodas.

Slide5

Defining Density

You can

think of density as

how much mass there is in a given volume

.

D

=

mass/volumeRegular Coke Diet Coke Volume: 382 mL Volume: 382 mL Mass: 387 g Mass: 367 gVolumes are the same, but the masses are different.Density calculations:Regular: D= 387 g / 382 mL = 1.01 g/mLDiet: D= 367 g/ 382 mL = 0.96 g/mL

Slide6

IV. Density of Coke and Diet Coke

Regular soda contains 39 g of sugar (=

14 packets of sugar

), while diet soda contains none (but it does have artificial sweetener).

Slide7

III. Coke/Diet Coke Density: Demo

Fill clear bucket with water and place 1 Coke can and 1 Diet Coke can next to it.

Ask students what will happen when you place the cans in water.

Put Coke can in water (sinks). Put Diet Coke can in water (floats).

After students try to guess why, tell them that

the difference between the cans is density

.

Slide8

III. Defining Density

After asking for students’ definitions, tell them that they can think of density as

how much mass there is in a given volume

.

Write the density equation on the board (D= m/v) and explain that density equals mass divided by volume.

Slide9

III. Defining Density: Demo

Show students glass jar with marbles in it. Explain that marbles represent water molecules.

Pour 1 packet of sugar into jar. Explain that sugar packs around water molecules in regular Coke just as it does in water.

Ask students why regular Coke is denser than Diet Coke. Answer:

Regular Coke has a higher mass because of the added sugar, which makes it denser.

Slide10

V. Are Soda Pop Drinks Acidic or Basic?

Place well plate on observation sheet

Using different pipette for each liquid

, follow the chart and half-fill each well with the correct liquid.

Pure Water

pH = 7

Coke Classic

pH = 2.63VinegarpH = 2.4Battery AcidpH = 1.0PepsipH = 2.49

Slide11

V. Are Soda Pop Drinks Acidic or Basic?

A

dd a squirt of Universal Indicator to the liquids

in row 1

and determine their

pHs

. Is there any difference between regular and diet sodas? Is the pH of sodas closer to vinegar or to water?

Slide12

VI. Why Are Soda Pops Acidic? Demo

Add a piece of dry ice to a cup or bucket full of water with a good amount of universal indicator. Note the color change.

CO

2

+ H

2

O

 H2CO3 (carbonic acid)

Slide13

VI. Why Are Soda Pops Acidic? Experiment

Compare ingredients of soda pops and club soda. Club soda has no other additives besides CO

2

.

Follow the chart and use a pipette to

half-fill each well with the correct liquid

in row 2

.Add a squirt of universal indicator to the liquids in row 2 and determine their pHs.QuestionsDid “degassing” the club soda change the pH? What causes the acidic pH of club soda?

Slide14

VI. Why Are Soda Pops Acidic? Experiment

Ask questions:

Slide15

VII. Testing for Sugars

What do you use as a sweetener on or in foods? (sugar, maple syrup, honey, artificial sweeteners such as aspartame)

Background info:

All the sweetener consumed in 1970 came from cane or sugar beets.

White stuff that you have in a bowl at home, called sucrose.

Slide16

VII. Testing for Sugars

What is the difference between sucrose and high fructose corn syrup? (sucrose is a disaccharide, composed of

glucose

and

fructose

)

Do our bodies use these different sugars in different ways?

Glucose is an intermediate form of energy and requires insulin to regulate its metabolism. Excess glucose is excreted.Fructose, however, functions independent of insulin and excess is stored as fat.+=Glucose + Fructose = Sucrose

Slide17

VII. Testing for Sugars

Background (cont’d)

Although glucose and fructose have the same calories per gram, our bodies store them in different ways

Glucose is an intermediate form of energy and requires insulin to regulate its metabolism. Excess glucose is excreted.

Fructose, however, functions independent of insulin and excess is stored as fat.

Glucose test strips indicate glucose levels for diabetic patients.

Slide18

VII. Testing for Sugars

Experiment:

Place bottles of glucose, fructose, sucrose, and water on appropriate circles on Observation Sheet. Remove caps.

Use tweezers

to dip a test strip in each bottle, and place test strip in corresponding rectangle on Observation sheet.

Pipette correct soda into indicated wells of plate, and follow procedure above with glucose test strips.

Replace caps on bottles. Wait a few minutes, then compare color development on test strips.

Slide19

VII. Testing for Sugars

What coloration do you notice?

What do you think green vs. yellow means?

What does the absence of green on some test strips indicate?

Did green develop for non-glucose sugars? What does this imply about the specificity of the glucose molecule?

If glucose was found in soda, are there still other sugar molecules? (Remember that soda uses HFCS)