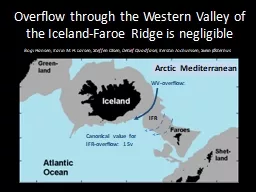
Bogi Hansen Karin M H Larsen Steffen Olsen Detlef Quadfasel Kerstin Jochumsen Svein Østerhus Canonical value for IFRoverflow 1 Sv IFR Arctic Mediterranean WVoverflow Western Valley overflow ID: 791930
Download The PPT/PDF document "Overflow through the Western Valley of t..." is the property of its rightful owner. Permission is granted to download and print the materials on this web site for personal, non-commercial use only, and to display it on your personal computer provided you do not modify the materials and that you retain all copyright notices contained in the materials. By downloading content from our website, you accept the terms of this agreement.
Slide1
Overflow through the Western Valley of the Iceland-Faroe Ridge is negligible
Bogi Hansen, Karin M. H. Larsen, Steffen Olsen, Detlef Quadfasel, Kerstin Jochumsen, Svein Østerhus
Canonical value for
IFR-overflow: 1 Sv
IFR
Arctic Mediterranean
WV-overflow:
Slide2Western Valley overflow
Persistent
Perkins et al. (1998):
Strong bottom current
Quadfasel:
ADCP moored 2 years
Field experiment
2016-2017
Western Valley
Perkins et al. (1998):
“
find no evidence for significant flow through the WV”
Strong
Upstream interface
300m above
Western Valley sill
Slide3WOW field experiment
3 moorings, 278 days
Temperature during recovery cruise May 2017
Bottom temperature
Bottom temperature
ADCP
Overflow water
Width < 20 km
Slide4278 daily averaged ADCP profiles
ADCP
Average velocity
Transport density:
Overall average: <q> = 1.5 m
2
/s
Volume transport:
(Transport density) × (Width)
(1.5 m
2
/s) × (20 km)
≤ 0.03 Sv
Overflow
Slide5Height of overflow layer above ADCP
3°C
h = h
0
+ h
1
– h2
h
h
0
h1
h
2
h
1
=
(3°C
– T
A
) × 31m
h
2
= L
× tan(
ϕ
)
L
ϕ
tan(
ϕ
) is calculated from velocity shear by Thermal Wind Eq.
h
C
T
C
Correlation between
h
C
and
T
C
is -0.73
Transport density:
Slide6Transport density at ADCP site
Atlantic inflow
Inflow strong
Inflow weak
Weekly averaged transport density:
R = -0.64
Atlantic inflow blocks WV-overflow
Friction between inflow and overflow
Thermal wind equation: Strong shear gives thin overflow layer
Sea level difference generates barotropic pressure gradient
Slide7Thermal wind equation
Weak Atlantic inflow
Weak shear
Strong Atlantic inflow
Strong shear
Overflow layer
A thinner overlow layer is more sensitive to bottom friction
Slide8Barotropic pressure gradient
.
Bernoulli: ½∙
U
2
= ∙(
p
U
– p
S
) =
g
∙( ∙
∆
D -
∆η
)
1
ρ
0
∆
ρ
ρ
0
1
2000
∙ 200m
- 10 cm
Mean Dynamic Topography
= 0
U
∆D
∆
η
ρ
0
+∆
ρ
ρ
0
)
p
U
p
S
Upstream
Upstream
Sill
Slide9During the period of our field experiment, the average WV-overflow was < 0.03 Sv
Was the period perhaps abnormal ???????
Slide10Satellite altimetry
Overflow transport density at ADCP site is correlated with velocity at 135m depth: R = - 0.64
Velocity at 135m depth is correlated with sea level tilt from satellite altimetry: R = 0.86
Overflow transport density at ADCP site is correlated with sea level tilt : R = - 0.60
This allows regression to reproduce overflow transport density for whole altimetry period
Average
Average overflow 1993 - 2016
Transport density < 5 m
2
/s Volume transport:(Transport density) × (Width) ≤ 0.1 Sv
FieldExp.
Slide11Total Iceland-Faroe Ridge overflow
Beaird et al. (2013)
0.3 Sv
<0.1 Sv
?
Slide12Funding agencies:
The Danish Energy Agency as part of the Arctic Climate Support Programme (Western Valley Overflow project).
RACE II – Regional Atlantic Circulation and Global Change funded by the German Federal Ministry for Education and Research (BMBF),
Förderkennzeichen 03F0729B.
The Blue-Action project has received funding from the European Union's Horizon 2020 research and innovation programme under grant agreement No 727852.