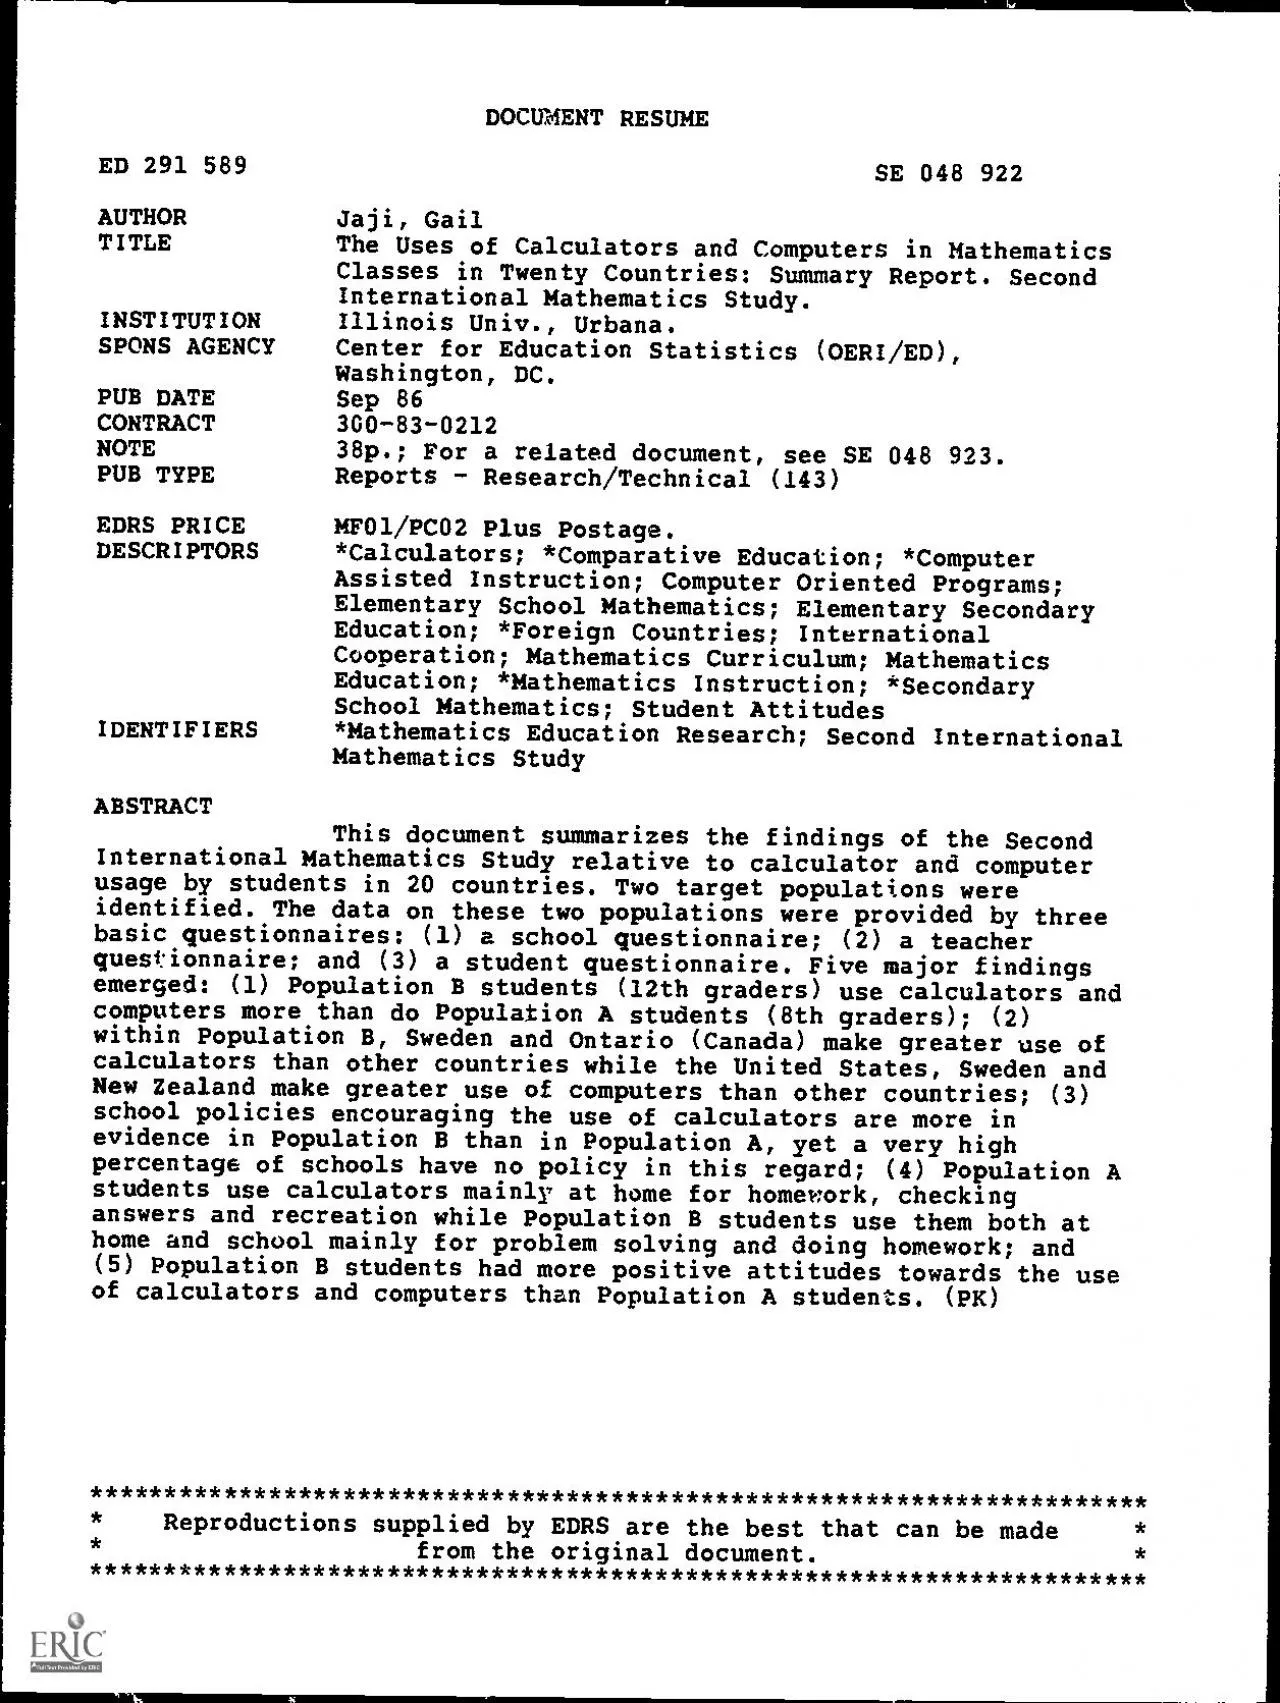
/
DOCUMENT RESUMEED 291 589SE 048 922AUTHORJaji GailTITLEThe Uses of Ca DOCUMENT RESUMEED 291 589SE 048 922AUTHORJaji GailTITLEThe Uses of Ca

DOCUMENT RESUMEED 291 589SE 048 922AUTHORJaji GailTITLEThe Uses of Ca - PDF document

rose
rose . @rose
Follow
342 views
Uploaded On 2021-07-07

DOCUMENT RESUMEED 291 589SE 048 922AUTHORJaji GailTITLEThe Uses of Ca - PPT Presentation

Second International Mathematics StudyThe Uses of Calculators and Computersin Mathematics Classes in Twenty CountriesSummary ReportCenter for Education StatisticsOffice of EducationalResearch and Imp ID: 855197

students population calculator calculators population students calculators calculator percent countries ontario computers school flemish usa french mathematics sweden schools

Share:

Link:

Embed:

Download Presentation from below link

Download Pdf The PPT/PDF document "DOCUMENT RESUMEED 291 589SE 048 922AUTHO..." is the property of its rightful owner. Permission is granted to download and print the materials on this web site for personal, non-commercial use only, and to display it on your personal computer provided you do not modify the materials and that you retain all copyright notices contained in the materials. By downloading content from our website, you accept the terms of this agreement.


Presentation Transcript

1 DOCUMENT RESUMEED 291 589SE 048 922AUTHO
DOCUMENT RESUMEED 291 589SE 048 922AUTHORJaji, GailTITLEThe Uses of Calculators and Computers in MathematicsClasses in Twenty Countries: Summary Report. SecondInternational Mathematics Study.INSTITUTIONIllinois Univ., Urbana.SPONS AGENCYCenter for Education Statistics (OERI /ED),Washington, DC.PUB DATESep 86CONTRACT300-83-0212NOTE38p.; For a related document,see SE 048 923.PUB TYPEReports - Research/Technical (143)EDRS PRICEMF01/PCO2 Plus Postage.DESCRIPTORS*Calculators; *Comparative Education; *ComputerAssisted Instruction; Computer OrientedPrograms;Elementary School Mathematics; Elementary SecondaryEducation; *Foreign Countries; InternationalCooperation; Mathematics Curriculum; MathematicsEducation; *Mathematics Instruction; *SecondarySchool Mathematics; Student AttitudesIDENTIFIERS*Mathematics Education Research; Second InternationalMathematics StudyABSTRACTThis document summarizes the findings ofthe SecondInternational Mathematics Study relativeto calculator and computerusage by students in 20 countries. Two target populationswereidentified. The data on these two populationswere provi

2 ded by threebasic questionnaires: (1)a s
ded by threebasic questionnaires: (1)a school questionnaire; (2) a teacherquestionnaire; and (3) a student questionnaire. Fivemajor findingsemerged: (1) Population B students (12th graders)use calculators andcomputers more than do Population A students (8th graders); (2)within Population B, Sweden and Ontario (Canada)make greater use ofcalculators than other countries while the UnitedStates, Sweden andNew Zealand make greater use of computers than othercountries; (3)school policies encouraging theuse of calculators are more inevidence in Population B than in Population A,yet a very highpercentage of schools have no policy in this regard; (4)Population Astudents use calculators mainly at home for homework,checkinganswers and recreation while Population B studentsuse them both athome and school mainly for problem solving and doinghomework; and(5) Population B students hadmore positive attitudes towards the useof calculators and computers than PopulationA students. (PK)***********************************************************************Reproductions supplied by EDRSare the best that can b

3 e madefrom the original document.*******
e madefrom the original document.*********************************************************************** Second International Mathematics StudyThe Uses of Calculators and Computersin Mathematics Classes in Twenty Countries.Summary ReportCenter for Education StatisticsOffice of EducationalResearch and ImprovementU.S. Department of EducationContractor's Report2U.S. DEPART MENT OF EDUCATIONOnce o Educatonal Research and ImprovementEDUCATIONAL RESOURCES INFORMATIONCENTER (ERIC)jThis document has been reproduced asreceived from the person or Organizationonginaling itL Minor changes have been made 10 improvereproduction qualityPoints ohnew or opinions stated in thisdocument do not necessarily represent OfficialOERI posit)On or policyBESI COPYAVAILABLE Second International Mathematics StudyThe Uses of Calculators and Computers inMathematics Classes in Twenty Countries:Summary ReportGail JajiUniversity of Illinois at Urbana-ChampaignLarry E. Suter, Project OfficerCenter for Education StatisticsPrepared in part for the Center for EducationStatistics under contract OE 300-83-0212.Opinions, conclusi

4 ons or recommendationscontained herein a
ons or recommendationscontained herein are those of the author, andnot necessarily those of the U.S. Departmentof Education.September 19863 ContentsPage1.Introduction12.Comparative Use of Calculators andComputers inPopulations A and B23.School Policies34.Uses Made of Calculators45.Attitudes Towards Calculators andComputers56.Summary6Tables1.Teacher Use of Calculators:By Population82.School Policy and Use of Calculators:By Population93.Where Calculators are Used by Students:1981104.Uses Made of the Calculator by Students:1981115.Students Endorsing the Opinion That Usinga Handheld CalculatorCan help You Learn Many Different MathematicsTopics:1981126.Students Endorsing the Opinion ThatEveryone Should Learn SomethingAbout Computers:1981137.Population B Student Attitudes TowardCalculators14 Figures1.Teacher Calculator Use for Population A: 19812.Teacher Calculator Use for Population B: 19813.Department Policies on Calculator Use for Population A: 19814.Department Policies on Calculator Use for Population B: 19815.Where Calculators are Used by Population A Students: 19816.Where Calculators are

5 Used by Population B Students: 19817.Use
Used by Population B Students: 19817.Uses Made of Calculators by Population A Students: 19818.Uses Made of Calculators by Population B Students: 19819.Students Endorsing the Opinion That Usinga Hand-held CalculatorCan Help You Learn Many Different Mathematics Topics: 198110. Students Endorsing the Opinion That EveryoneShould Learn SomethingAbout Computers: 1981AppendicesAppendix I - Sample Sizes for Schools, Teachers and Students5 1.IntroductionAs a part of the Second International MathematicsStudy,datawerecollectedoncalculatorand computer use in schools in twenty countries.In the Study, two target populations were identified:PopulationA:Allstudentsinthegradein which themajority of students had attainedtheageof13.0-13.11yearsbythemiddle of the school year (for the USA thiswas the eighth grade).Population B: All students who are in the normallyacceptedterminal grade of the secondary education system,andwhostudymathematicsas a substantial part of their academicprogram (studentsintwelfthgradecollegepreparatorymathematics in the USA).It should be noted that Population A, by definition,include

6 s a broadcross-section of students.It sp
s a broadcross-section of students.It specifies that all students in the gradearetargeted for study.By contrast, Population B is a veryselectivegroup.Itincludesonlythosestudentswhohavecontinuedtheirstudyofmathematicsthroughtotheendofsecondaryschool.Thisisthe"mathematics specialist' group of students andincludes as few as 6 percentof the age group in some countries (e.g.EnglandandNewZealand.)Inothercountries,suchasCanada(BritishColumbia)and Hungary, thisproportion is as large as 30 percent and 50percent, respectively.Thetwotargetpopulationsalsodifferconsiderablyinage.PopulationAstudentsare typically 13 years of age at the middle of theschool year.(However, for two countries, Japan and HongKong, twelve yearoldswereselected.)PopulationBstudents,ontheother hand, aretypically 17 years of age, with students insome countries (e.g. Sweden andFinland) having mean ages as highas 19 years.The data on thesetwopopulationswereprovidedbythreebasicquestionnaires for each Population: 1)a school questionnaire, 2) a teacherquestionnaire, and 3) a student questionnaire.The sample sizes aregivenin Appendix I.

7 Note: The data are in terms of the perce
Note: The data are in terms of the percentage of thetotal sample reporting(not the percentage of only those responding).Since therewereinmanycaseshigh non-response rates, interpretation of the findings mustbe donewith care.6 2A study aslargeandcomprehensiveastheSecondInternationalMathematicsStudyincludesnot only the different target populationsbutvastly differentculturalsettings.Forexample,theStudyincludedadvancedindustrializedcountriessuchasJapan and the United States,together with developing countries suchas Thailand andNigeria.Itwasexpectedthatsuchdifferencesin the nature of the target populations,together with contrasts in cultureandtechnologicaldevelopment,wouldleadtovariationsintheuse and role of calculators and computers inschools as well as other educational policiesand practices.It was found,forexample,thatcalculatorusagewasmuchhigheringeneralforPopulation B than for Population A.(That is,calculatorusageismuchmoreestablishedin advanced school mathematics classes than atthe lowersecondary school level.)Differenceswere also foundbetweencountriesatthesame grade level.For example, Sw

8 eden and Canada (Ontario)make heavyuse o
eden and Canada (Ontario)make heavyuse of calculators while Japan and Hungary make littleuse of thedevices,evenatthe Population B level.With respect to computers,even less usewas made than was made of calculators.Students were found tohavegenerallypositiveattitudestowardscalculatorsandcomputers.Thisfavorableoutlookwasfoundin allcountries, and was more positive in the advancedclasses than at thelowerlevel of the secondary school.2.Comparative Use of Calculators and Computersin Populations A and BOverall, much more use is made of calculatorsin Population B than inPopulationA.Note, for example, the data in Table 1.For Population A,teachers report a median of only 6percentusingcalculatorsfrequently(oneormoreperiodsper week) across all countries.This usage rangedfrom a low of zero for Finland and Thailandto a high usage of10percentinCanada(Ontario)andSwedenwith11percentreported in Nigeria.Figures 1 and 2 show this pattern quite clearly.It was also found that much greateruse is made of calculatorsamongPopulationBinsomecountries than in others.Sweden (95 percent) andOntario, Canada (78 percent)

9 made frequentuseofcalculatorswhileinJapa
made frequentuseofcalculatorswhileinJapanno teacher reported frequent use and 92 percent reportednever usingcalculators (88 percent neveruse and 4 percent not allowed).InHungaryand Thailand only 4 percent and 8, respectively,report frequent use and 32percent and 27 percent reportneverusingcalculators.HongKongalsoreportedfairlylimitedfrequentuse (22 percent) but 46 percent of theteachers there reportedoccasionaluseofcalculators.Theremainingcountries wereneartheinternationalmedianof53 percent.Only inSweden, USA and New Zealand do more than 10 percentofthePopulationBstudentsreportusingacomputerin their classes (the USA reports thehighest use of the computer in otherclasses and Sweden reports the highestusein mathematics classes).For all other countries the use of computersin classes or even at home is reportedas beingalmostnegligible.Thispattern is shown in Figure 2.7 3Of interest is the fact that in Israel 53 percentof themathematicsteachersindicatedfrequentuseof the programmable calculator in classwhereasnostudentsreportedusingthesedevices(oranysortofcalculators) in class.3.School Policies

10 The data from the schools questionnaire
The data from the schools questionnaire (Table2 and Figures 3 and 4)indicate that in most of the countries theuse of a calculator is forbiddenin a large number of schools.Only limited use is made ofthecalculatorinmostof the other schools.An exception is Sweden where 25 percentofthe schools make frequent use and 40 percentlimited use of the calculator.Inonly1percentoftheSwedish schools is the use of the calculatorforbidden.In Japan and New Zealand abouta third of theschoolsprovidecalculators yet the calculatorsare still rarely used.Among Population B schools only Japan (12 percent)forbids the use ofcalculatorsinmorethan10percentofthe schools.The USA has thehighest percentage of schools that haveno policy regarding calculators (56percent-internationalmedian = 20 percent).In Thailand 27 percent oftheschoolsindicateunavailability.Forallothercountriesthepercentagereportingunavailability of calculators is 11 percentor less.InSweden79percentoftheschoolsindicatefrequentuseofthecalculatorswhichareprovidedby the school and in Flemish Belgium thepercentage is 34 percent.All other countries report le

11 ss than 20percentoftheschoolsmakefrequen
ss than 20percentoftheschoolsmakefrequentuseof the calculator.Ontario, Canada,England and Wales, New Zealand, and Scotlandall report that limited use ismade of the calculator (it is either not providedbut permitted or providedand rarely used).4.Uses Made of CalculatorsThe data on place of use for calculatorsare contained in Table 3 andshownin Figures 5 and 6.For Population A students only Ontario, Canada;Sweden; and the USA reportasmanyas25percentusecalculatorsinmathematicsclasses.Thirtypercentormoreof students in the USA,Sweden, New Zealand, Luxembourg, Israel, EnglandandWalesandOntario,Canadareportnousemadeof calculators.This may not be an accuratepicture.There was a very high non-response rate andthusitislikelythat the percentage were even higherand were probably high for many of theother countries as well.More than 30 percent of the students in Scotland,New Zealand, Netherlands, Luxembourg,Japan, Hong Kong, France, England andWales, Ontario, Canada and French Belgiumreportedusingcalculatorsathome.For Population B, it was found that inHungary(61percent)hadahighpercentagereporting non-u

12 se of calculators.Over 40 percent of the
se of calculators.Over 40 percent of thestudents in the USA, Sweden, Scotland, NewZealand,HongKong,Finland,8. England and Wales, Canada (both Ontario and British Columbia)Belgium (bothFrench and Flemish) report using calculators in allthree places, namely athome,inmathematics class and in other classes.More than 90 percent ofthe students in Sweden and England and Walesuse calculators in mathematicsclass and over 80 percent in these two countriesuse them in other classes.These two countries report. similarly high percentagesusing calculatorsathome.Contrast this with Israel where no one reportsusing a calculator inmathematics classes and Japan where only 5 percentof thestudentsreportthisuse.Onlyabout10 percent of the students in Japan,Thailand andHungary report using programmable calculators inotherclasses.Only16percentofstudents in Hungary and 20 percent of Japanesestudents reporthome use of theprogrammablecalculator(inJapan60percentofthestudents report they use four-function calculatorsat home).Also of interest here is the fact that onlythreecountries(Japan,HongKong and Thailand) report a

13 ny significantuse of the abacus.For allt
ny significantuse of the abacus.For allthree countries both Population A and Population Bstudents reportedusingtheabacusat home only.Apparently, this traditional calculation devicereceives no usage in the schools.For the computer, 10 percent of the JapanesePopulationAstudentsreportusingitathome while for all other countries the percentageisconsiderably lower.Otherwise, very little use is made of the computeratthislevel.For Population B, 22 percent of the students in Swedenreportusing the computer in mathematics class.Nineteen percent of USA students,14 percent of Swedish students, 13 percent ofstudents from New Zealand and10 percent of English students report usingcomputersinotherclasses.Forallother countries and categories of use the percentageis less than10 percent.It is clear very little use was yet beingmadeofcomputerseither at home or at school in 1981.Data on the typesofusesmadeofcalculatorsbystudentsarepresentedinTable4 and shown in Figures 7 and 8.For Population A themost popular use of the calculator among studentswas for checkinganswersand the second most popular usewas for doin

14 g homework.Contrast this withwhattheteac
g homework.Contrast this withwhattheteacherssaidtheyencouraged.Teachersencouragedusingcalculatorsorcheckinganswersfollowedby using them for recreation.Using calculators for doing homeworkwas next to thelowestinorderofpriority of use among the teachers.For Population B, using calculators for doinghomeworkfollowedbyproblemsolvingwasgiventhe highest priority whereas the teachers hadindicated they encouragedproblemsolvingfollowedbyhomework.Bothstudentsandteachersagreedthat using a calculator for recreationwaslowest in priority of their uses for the calculator.Notetherelativelyconsistent lower use of the calculator in thesevaried areas by students inJapan, Hungary and Thailand as compared with othercountries.Thereverse(consistentlyhighuseofcalculatorsfor varied purposes) is true forstudents in French Belgium exceptfordoingprojectswherenostudentreports using a calculator.9 55.Attitudes Towards Calculators and ComputersStudent attitudes toward calculators and computersweremeasuredbyaskingthemtoindicatetheiragreementwithstatementssuch as thefollowing.Sample Statement 1: Using a hand-held calculat

15 orcan help youlearnmany different mathem
orcan help youlearnmany different mathematical topics.As is shown in Table 5, about one-third ofthe Population Astudentsinmostcountriesendorsedthisstatement but the Population B studentresponse pattern was much more varied.Sample Statement 2: Everyone should learnsomething about computers.As Table 6 reports, a very large percentage ofPopulation Bstudentsendorse this statement but a smaller percentage ofPopulation A students doso.These data are graphed in Figures 9 and 10.There seems to besomerelationshipwithinPopulationBbetweenfrequentuseof calculators and opinions held about theusefulness of thecalculator for learning mathematical topics.InSweden,wherethemostfrequentuseofcalculators is reported, students also seemed tobe mostpositive in their opinions.With the exception of HongKong,whereonlyoccasionalhighuseof calculators was reported, all countriesreportinghighpercentagesofpositiveattitudesalsoreportedhighuseofcalculators.In countries where low percentages of studentsendorsing theusefulness of the calculator were reported,teachers reported little ornouseofthe calculators.An exception (s

16 uch as Japan and Hungary)was NewZealand
uch as Japan and Hungary)was NewZealand where few endorsed the usefulness of thecalculatorbutreportedhighfrequentuse.Thiswouldsuggest that there is some relationshipbetween greater useofthecalculatorandmorepositiveopinionsoncalculator use.No such relationship is apparent in the dataon computers.It may bethatatthe time of the study so littleuse was made of computers in mostcountries that little influence was yet exerted.On the whole, student attitudes toward theuseofcalculatorsandcomputerswere positive.Population B students were more positive towardsusingcomputersandcalculatorsthanwerePopulationAstudents.PopulationAstudentsinFrenchBelgiumand Ontario, Canada were morepositive towards using calculators thanwerethoseinothercountries.PopulationAstudentsin Canada (British Columbia) and the USA weremorepositive towards the use of computers thanwere their counterparts in othercountries.PopulationA students in Japan were less positive towards theuse of computers than were students in other countries.10 6Within Population B, differences in opinionwerenotveryclearlyseenbetween countries.But these ad

17 vanced mathematics studentswere morefirm
vanced mathematics studentswere morefirmly convinced that it was more funtolearnmathematicalideaswhenusingahand-heldcalculatorthantheywereaboutthe usefulness ofcalculators for mathematical topics, the importance of learningtocomputewhenusinga calculator or that it's more fun to solve word problems whenusing a hand-held calculator.With respect to the computer,theadvancedstudentstendedtofeelthat using computers makes learning mathematicsmechanical and boring.They tended to strongly agree thateveryoneshouldlearn about computers and that computers do lots ofgood things for people.(See Table 4.)The Population B students were askedtoindicatewhetherusingahand-heldcalculatorwasanactivitytheyliked,found hard, and wasimportant.On the whole, they werequitepositivetowardsuseofthecalculator.StudentsinThailand,JapanandFrenchBelgiumwereconsiderably less positive than those in other countries.In thecaseofThailand,morestudentsheld negative views about using calculators thandid studentsinothercountries.Evenso,55percentoftheThaiPopulationBstudents liked using a hand-held calculator, 84percent feltit was eas

18 y and 39 percent saw thisuse as importan
y and 39 percent saw thisuse as important (note however that53percent saw it as unimportant.Students in Hungary also held this markedlydifferent viewfromthatexpressedbythemajority(65percentnotimportant;23percentimportant).In the two countries where therewaslittle use ofthecalculatorsamongPopulationBstudent(JapInandThailand)studentsheld less positive attitudes towards calculators.Thereverse (countries where frequent use was made holdingmore positive views)wasnotapparent.Takingthepopulationsasa whole it appears thatPopulation B, whichmadegreateruseofcalculators,alsoheldmorepositiveviewsthanPopulationA,whichmademuchlessuseof thecalculators.6.SummaryDuring 1980-1982, (the time the datawere collected) very limited usewasmadeof the calculator among Population A students.School policy atthis level was somewhat restrictive.When studentsdidusecalculators,theytendedtouse them at home for doing homework, checking answers andfor recreational purposes.One wonders ifteachersatthislevelwereconcentratingon computational skills and therefore felt calculators mightprove detrimental to this development.For

19 whatever the reason, PopulationAmade les
whatever the reason, PopulationAmade less use of calculators than Population B.Even among Population Bit was not a large majority who madeuse of the calculator.Schoolpolicyandteacherencouragementweremuchmore positive for this group.ThePopulation B students tended to use theprogrammablecalculatorbothathomeandat school though on the whole home use wasmore extensive.Theytended to use calculators forproblemsolvinganddoinghomeworkwithrecreation the least popular use. Within Population B, Sweden and Canada (Ontario) made greateruseofcalculators than didother countries.Japan, Hungary and Thailand mademuch less use of calculators than the other countries.Only Sweden,theUSAandNewZealand made much use of the computer with the USAreportingthe greatest use in other classes and Sweden reporting thegreatest useofmathematicclasses.Attitudesonthewholewereonlyslightly morepositive than negative towards using calculators andcomputers.PopulationBwasmorepositivetowardsthat use than Population A.Other than interms of the whole populationthereseemedlittlerelationshipbetweenattitudes and extensiveness of use of

20 calculators.Thus emerge the five major
calculators.Thus emerge the five major findings:1) Population B students use calculators andcomputers morethan do Population A students.2)WithinPopulationB, Sweden and Canada (Ontario) makegreater use of calculators than other countrieswhiletheUSA,Swedenand New Zealand make greater use of computersthan other countries.3)Schoolpolicies encouraging the use of calculators aremore in evidence in Population B than in Population A,yetaveryhighpercentage of, schools have no policy in thisregard.4) Population A studentsuse calculators mainly at home forhomework, checking answers and recreation whilePopulationBstudentsusethembothat home and school mainly forproblem solving and doing homework.5)PopulationBstudentshadmorepositiveattitudestowardstheuseofcalculatorsandcomputersthanPopulation A students. 8Table 1Teacher Use of Calculators: By Population(Percentage of Teachers)Extent of UseCountryFrequently(one or moreperiods pep week)Occasion-allyNeverNotAllowedNoResponsePOPULATION A: Four-Function CalculatorsBelgium (Flemish)1850395Belgium (French)7236605Canada (BC)23622318Canada (Ontario)103424288En

21 gland and Wales5,3334199Finland01850255F
gland and Wales5,3334199Finland01850255France13643168Hong Kong3128312Hungary------100Israel11140077Japan1386111Luxembourg331272415Netherlands21032524New Zealand22745245Nigeria1111362915Scotland21323593Swaziland448804Sweden105811120Thailand01711513USA62933302POPULATION B: Programmable CalculatorsBelgium (Flemish)59307012Belgium (French)59237012Canada (BC)42264225Canada (Ontario)57254319England and Wales7813318Finland421510132Hong Kong224614018Hungary41632048Israel531322013Japan058842New Zealand5434309Scotland60221017Sweden951004Thailand8827056USA482313017 9Table 2School Policy and Use of Calculators: ByPopulationCountryPercent ReportingNo Policy Calculator Limited Frequent CalculatorNoForbiddenUseUseUnavailable ResponsePOPULATION A: Four-function CalculatorsBelgium (Flemish)235313362Belgium (French)451532404Canada (BC)482416147Canada (Ontario)5115143161England and Wales282041921Finland2216343231France3292342013Hong Kong2245150810Hungary1721110464Israel2351922327Japan232446160Luxembourg521726022Netherlands195816304New Zealand41940460Nigeria755100245Scotland46716157Swaziland25440588Sweden114

22 14025119Thailand1329140395USA5213181152P
14025119Thailand1329140395USA5213181152POPULATION B: Programmable CalculatorsBelgium (Flemish)190433421Belgium (French)3203915104Canada (BC)28159515Canada (Ontario)16177033England and Wales12473542Finland166606110Hong Kong28651069Hungary227302371Israel200588014Japan351242443New Zealand23070440Scotland7976224Sweden20187902Thailand3062322713USA5632757214 IIIaIi11IIIIIII1Iii10Table 3Where Calculators are Used by Students: 1981CountryHomePercent ReportingMathematicsOtherClassClassesAllNoneNoResponsePOPULATION A: Four Function CalculatorBelgium (Flemish)333411580Belgium (Frerth)47892051Canada (BC)3333097Canada (Ontario)652997303England and Wales461584436Finland24741070France691142033Hong Kong37652060Hungary13211089Israel240605919Japan43340052Luxembourg437313125Netherlands36783060New Zealand431485525Nigeria2110097Scotland381031057Swaziland*--------100Sweden274b21347Thailand28541068USA2325953340POPULATION B: Programmable/Scientific.*Belgium (Flemish)4219164702*Belgium (French)34171847012Canada (BC)59575549036Canada (Ontario)616255512835England and Wales9290807765Finland66665148031Hong Kong766869

23 63022Hungary1681056121Israel5504401222Ja
63022Hungary1681056121Israel5504401222Japan-20(60)5(2)11(16)2(3)0(0)73(31)New Zealand67646252027Scotland73706257024Sweden8993827906Thailand2916115060USA646955432024*Population B students reportinguse of four-function calculator only.-Population B students reporting greateruse of four-function calculator,percentages for four-function calculator given in parentheses.All students reporting this use whether onlyor in combination with othercategories of use except for those reporting all three.15 11Table 4Uses Made of Calculators by Students: 1981CountryCheckingAnswersProblemSolvingPercent Reporting*TakingDoingTestsProjectsRecrea-tionDoingHomeworkPOPULATION ABelgium (Flemish)2814382236Belgium (French)83818008189Canada (BC)31375223539Canada (Ontario)543345411England and Wales514311182043Finland282617182734France3718601373Hong Kong35258133621Hungary5310110Israel312111273421Japan24145101523Luxembourg77726807089Netherlands402312212434New Zealand32335164035Nigeria454456Scotland23267101129Swaziland192121181422Sweden396321143638Thailand17145113721USA35409212642POPULATION BBelgium (Flemish)27585201197

24 Belgium (French)93959408699Canada (BC)43
Belgium (French)93959408699Canada (BC)439376583093Canada (Ontario)77562319717England and Wales449687462497Finland739597687896Hong Kong209396826997Hungary194460252Israel716771675970Japan3531332247New Zealand459269633193Scotland25857422286Sweden629494676092Thailand41395201744USA587970482777*Percent reported is the combined percentageof students reporting eitherusing a four-function calculator or a scientific/programmablecalculator.16 12Table 5Students Endorsing the Opinion gnat Usinga Hand-held CalculatorCan Help You Learn Many Different liathematics Topics: 1981CountryPercent EndorsingPopulation APopulatic_ BBelgium (Flemish)3828Belgium (French)1847Canada (BC)3134Canada (Ontario)1944England and Wales42--Finland4527France37--Hong Kong3248Hungary3416Israel2835Japan3811Luxembourg15Netherlands36New Zealand3412Nigeria32--Scotland3442Swaziland----Sweden2748Thailand2826USA3341 II1IIII1III13Table 6Students Endorsing the Opinion That Everyone ShouldLearn SomethingAbout Computers: 1981CountryPercent EndorsingPopulation APopulation BBelgium (Flemish)3947Belgium (French)2387Canada (BC)6980Canada (Onta

25 rio)8880England and Wales--33Finland4579
rio)8880England and Wales--33Finland4579France34Hong Kong1848Hungary591Israel1356Japan2158Luxembourg21Netherlands24New Zealand5871Nigeria48Scotland4976Swaziland--Sweden4281Thailand7277USA6184I8 14Table 7Population B Student Attitudes Toward CalculatorsCountryPercent ReportingDislikeHardNot ImportantPercent ReportingLikeEasyImportantBelgium (Flemish)91114737567Belgium (French)81115637065Canada (BC)2017879670Canada (Ontario)3110758568England and Wales3018789362Finland228899384Hong Kong517869181Hungary12065719421Israel8116759166Japan11433436723New Zealand4220789059Scotland4126809457Sweden3112819275Thailand32453558439USA319859479Response categories were combinedas follows:Dislike: Aggregated from "Dislike" and "Dislikea lot"Hard: Aggregated from "Hard" and "Very hard"Not Important: Aggregated from "Not important"and"Not at all important"Like: Aggregated from "Like" and "Likea lot"Easy: Aggregated from "Easy" and "Very easy"Important: Aggregated from "Important" and "Veryimportant"19 I15Appendix ISample Sizes for Schools, Teachers and StudentsCountrySchoolsNTeachersNStudentsNPOPULATION ABelgiu

26 m (Flemish)1511541385Belgium (French)841
m (Flemish)1511541385Belgium (French)841052054Canada (British Columbia)89892158Canada (Ontario)1151734885England and Wales942442054Finland982064484France1793478329Hong Kong1251305548Hungary70701754Israel811403587Japan2122128091Luxembourg421072106Netherlands2362365500New Zealand1001895218Nigeria42451456Scotland763541356Swaziland2425904Sweden971863585Thailand98993821OSA1572766683POPULATION BBelgium (Flemish)1311802858Belgium (French)791512018Canada (British Columbia)78951948Canada (Ontario)761873190England and Wales3126133436Hong Kong1121253294Hungary91942443Israel64821810Japan1922077954New Zealand79791186Scotland542181501Sweden1271272712Thailand641073747USA150250464320 VIII NB INN1111UM INS1111111111al1111111N1111111111ES.+'.367+21Finure 1Teacher Calculator Use for PopulationA: 19811NGA11+---+-4-Two or more periodsper weekSWECI CFRACcNENW-E111(!USA!:NZE:IBFRI1+1FI NII! 13 GA!IISI,JA+-+-+JPN.Once per weekOccasionallyS1 AJPNH110THA+---+VIN/BFLtJZ1FRA1NGAUSAINT4IILUA't0flh*0CDCSWE1111ISRNeverSCiNThiBFLCUE:id\Nr:AlONffIN/1..UX/!"ZEtin-LFRATH11tJPN'ISWEIIHKIOBOIR/IP/SWA+-+Not allowed22 oSIM 4 M

27 N Mill1111111SIMRIBIII1111 IN OM IIIEll
N Mill1111111SIMRIBIII1111 IN OM IIIEll IN all'.5°0+11'022+11'.167+TUAHUNJFIN+-r,23Figure 2Teacher Calculator Use for Population8: 1981SWENW1111COC4N1USAIISR/NZEi-11FqCBBF4.F141H40JP1,1AOIHUNIIIINZFITHABFI.1CB1USAnFRA1Bh.ISO,IISRI''FINBFRIHUNIKOI,4A,NiEBIMI111I1FINZPNf0.........IFIN11?j3JPNBFL/1BFP1CD666N11SWE/.+-41NZOIENWTwo or moreOne periodOccassionallyNeverPeriodsper weekper weekpitlUBCNot allowed24 GIB1111111111la IN OS1111WI INN1111ND IN 111111111. 00Figure 3Department Policies on Calculator Use for PopulationA: 1981.1333.667+.500+.333+.167+.025USA/LUXCONC$CBFR;! FRA !ENW:SWAT01701FiN;Hkb471NIThHIiNSWETOANGANoPolicysEb;NTHNOABFL;47H71,1*JPN/CBCHUN;ENW+!!!!i! LUX!RFR/F0FRAYNZEISttSW'SWEBPRFIN/LUXISRHKO!!41--CBC/USASI4AS8EForbiddenMay UseNot ProvidedSWE*JPN4NZEFIN()ENW!;'USA';'FRA1! CBCStO/CdNProvidedUsed RarelySWE'ENWNZE/F4/BFRist--+----- It4--4-SWAFHUNJHurlTHAFIN/1:/NGA!USA!HU.V;BFRJUFHProvidedNotUsed FrequentlyAvailable26 MB r111111IIIIII111111IM w NMI MI MI111111118MN NW IIII1111Figure 41.00';+ei!!!!!. 033+1!NEC9NSCOiOWN;E!.667+FIlititiriCBGii!!1i HKO i.!USA!i!ii..1;300`+.13rc,i,J

28 PNBkiBFR1TVAiiiiaHalis. 333:.I3FRJrNAFLI
PNBkiBFR1TVAiiiiaHalis. 333:.I3FRJrNAFLI__1[1.!913c00FiUN/U4Aii4-1111TtIA1iSRt,51E. 1674.40-40NIENW'FRFINiS40JPNiBOi!ARONBp1SR.4--- F.IICBC/qUN/NZE11.____.*ENIni/MAJPN!SWEFIMaTHA+++!!-If ------*!0. 0LI$LCBdiCON*---*INoForbid enMay UsePrO"vide4dProzividedNotPolicyNot ProvidedUsed RarelyUsed Frequently AvailableDepartment Policies on Calculator Use forPopulation B: 19812728 illallMI1111NM IS1.00.833.667.500.333.167.oFioure 5wilsprp ralrulatnrc are Used by Population A Students: 1981FF\41361ENWJPN /LUX /NZESWEHOI NTHTWiLT!MPCONI SWOUSA+41.54ENW(ABCIFRA !NE4.600!75TITT0lglikEINLUX0-1HomeMathematicsClassUSA/CON(BFRNTH/RZE/EPWCOLSIIER!USA/NZE*FIKO*+---++---+*-+-*-- - + - - -+Other ClassesAll of Thesel$11NIHENWStIEU A+---+JPN!CON!None of These2930 as us ma am no um am ow um inENam amINas am ma am .1.00.833.667.500.333.167.0Figure+HomeENWSgE140NZE1FUSAICON'ISRTH4JPN+---+6I NIa?Where CalculatorsMathematicsareSIREENWSq0UlA414140'FIN,!NZE!CONCBCTHPHUNJPqeSRUsed by PopulationCONtUSA/CBC11.ClassOtherSWEF1( 4NZEFINISRHtAYPIClassesB Students: 1981ICON!I'FIN,NAllSWEEMW140soNEE+---+CBC:* - -USA)IUN41THAJP

29 Miol6theseHUU*NoneCONUSAENWThese3132 111
Miol6theseHUU*NoneCONUSAENWThese3132 111111111111111111111111111111111111111111111111111111111111111111111111 1.Figure 7Uses Made of Calculators by Population A Students: 19811.00+.833.867.500+.333.16733gFRLUXqpNEflWtITH9WEFKO/1tSAIMAEBIFL/ IN11S_Rj?CJP14+1 SCIRAqUNqGABFRLUXSWE0BFItLUXENWUAcpc11tbii*EFig NilcoI HioI Ntrilv_tsRISRCBCttSWEASWAFRAFINTOI11NBFL/M4THA1SWA/FINifft+litli+1 NZEtItISR/ENW*SWE*1'USA'I KONGA:UN!; Hli1+SCO+JPN/SICOHUNFRA+.8-F-b.1CJN /NGA1-CheckingSolvingTakingDoingAnswersProblemsTestsProjectsBRRLOXT ANESWE HKOCCI RUSA!3NTH!EN*---*JpolFRAt GAONEJUNRecreationBFR /11JXFR1,EN4USCBGSWIBFr,NZ-+NTil/FR1NGi*1-3P0SCTHA/ISR/RKOII+---+CON:HUNDoingHomework34 MN NMI MS AllalAllAll NM ISopNiowINN MI I= AllIIIIIMIv,1.00.833.667.500.333.167.o+Figure 8Uses Made of Calculators by PopulationB Students: 1981FNWWFRBEINI SWEICBC/HKO11ISCOI*---*QONUSAFINISR---+SWEUSA1,1tEENV',CBCTHAJPNBFL+$0.,140HVNI1Checking:15Answers+ISRBFLCON+---+II1IHUN1T[IA!1iJPNFIN11NE/BFBEMI/IICBCISCOIIISRIUSAIINZE*+BFLCOli+---+IIIIII.,1(0HA4PNJPNICBCBFL/MINKO!Fite,qE/EpEBrIlsWEI!SCO!!1HKO1USA!II1FIN16RII.I!FINHKOSW4

30 ISRI+fl2E+SWEISRCBCIUSAENV+SCOTHACON4---
ISRI+fl2E+SWEISRCBCIUSAENV+SCOTHACON4---+-HUNXBEL(BERSolvingTakingDoingProblemsTestsProjects4......- 4.iN1EICBC1'USAIENWJPNITHA!I'BFL+---+CONHUNI(SCORecreationHUNintTHA40N1IDoingHomework36++!i. Population APopulation BPercent Endorsing10080604020020406080100., I, .. _, iIl_t1Ii11SwedenHong KongBelgium (French)Canada (Ontario)ScotlandUSAIsraelCanada (BC)Belgium (Flemish)FinlandThailandHungaryNew ZealandJapanFigure 9Students Endorsing the Opinion that UsingaHand-heldCalculator Can Help You Learn ManyDifferent MathematicsTopics: 1981*Note: Only countries participating in bothPopulation studies arerepresented and are arranged accoringto Population B rank.37 4.Population APopulation BPercent Endorsing10080604020020406080100.1$a ijLL i,HungaryBelgium(French)USASwedenCanada(BC)Canada (Ontario)FinlandThailandScotlandNew ZealandJapanIsraelHong KongBelgium (Flemish)England and WalesFigure 10Students Endorsing the Opinionthat Everyone Should LearnSomething About Computers:1981*Note: Only countriesparticipating in both Populationstudies arerepresented and are arrangedaccording to Population B rank.38