PPT-Impact of State Reporting Laws on Central Line–Associated Bloodstream Infection Rates
Author : ryotheasy | Published Date : 2020-06-16
Hangsheng Liu Carolyn T A Herzig Andrew W Dick E Yoko Furuya Elaine Larson Julie Reagan Monika PogorzelskaMaziarz and Patricia W Stone Health Services Research
Presentation Embed Code
Download Presentation
Download Presentation The PPT/PDF document "Impact of State Reporting Laws on Centra..." is the property of its rightful owner. Permission is granted to download and print the materials on this website for personal, non-commercial use only, and to display it on your personal computer provided you do not modify the materials and that you retain all copyright notices contained in the materials. By downloading content from our website, you accept the terms of this agreement.
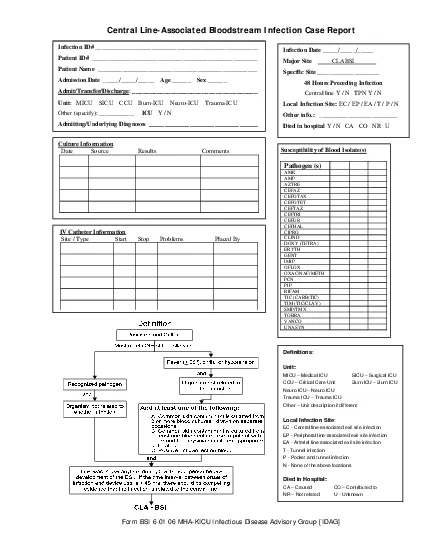
Impact of State Reporting Laws on Central Line–Associated Bloodstream Infection Rates: Transcript
Download Rules Of Document
"Impact of State Reporting Laws on Central Line–Associated Bloodstream Infection Rates"The content belongs to its owner. You may download and print it for personal use, without modification, and keep all copyright notices. By downloading, you agree to these terms.
Related Documents