/
Air Quality from Space Air Quality from Space

Air Quality from Space - PowerPoint Presentation

sherrill-nordquist
sherrill-nordquist . @sherrill-nordquist
Follow
401 views
Uploaded On 2016-12-15

Air Quality from Space - PPT Presentation

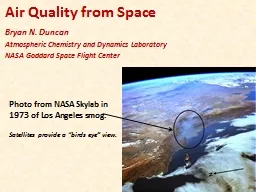
Bryan N Duncan Atmospheric Chemistry and Dynamics Laboratory NASA Goddard Space Flight Center Photo from NASA Skylab in 1973 of Los Angeles smog Satellites provide a birds eye view Smog ID: 501917

omi ozone 2005 satellite ozone omi satellite 2005 pollution rita katrina air amp instrument aura emissions isoprene power plants

Share:

Link:

Embed:

Download Presentation from below link

Download Presentation The PPT/PDF document "Air Quality from Space" is the property of its rightful owner. Permission is granted to download and print the materials on this web site for personal, non-commercial use only, and to display it on your personal computer provided you do not modify the materials and that you retain all copyright notices contained in the materials. By downloading content from our website, you accept the terms of this agreement.


Presentation Transcript

Slide1

Air Quality from Space

Bryan N. DuncanAtmospheric Chemistry and Dynamics LaboratoryNASA Goddard Space Flight Center

Photo from NASA Skylab in 1973 of Los Angeles smog.

Satellites provide a “birds eye” view.Slide2

Smog =

a noxious mixture of particulates & gases

Air Quality

In the US, 120 million people currently live in areas that do not meet air quality standardsSlide3

Where there are lights, there is pollution!

Visible Infrared Imaging Radiometer Suite (VIIRS

)o

n the Suomi NPP satelliteSlide4

Question:

Why does NASA monitor pollution? Isn’t that the job of the EPA?

Answer: Spatial coverage.

Instruments on NASA satellites can measure pollution over the whole U.S. and even the whole globe. Surface measurements are sparse and don’t give us the whole air pollution picture.Slide5

Haze over the Mid-Atlantic

Pollution has a global impact via long-range transport!

True Color Image from the Moderate

Resolution Imaging Spectroradiometer (MODIS) on the Terra satelliteSlide6

What are

NASA

instruments

measuring?Slide7

●The ozone standard is currently 75 ppbv as averaged over 8-hours.

● A new rule may lower the standard to 60 ppbv = European standard.

Source of graphic:Wall Street Journal, July 21, 2011

OzoneSlide8

A Quick Tutorial….

“Good” Ozone

Blocks most UV rays

“Bad” OzoneDamages LungsSlide9

Formaldehyde – a proxy for VOCs – a precursor to ozone

Isoprene is a VOC emitted from trees & emissions

increase with temperature.HCHO is a product of isoprene oxidation,

so variation in the concentration of HCHO can serve as a proxy for variation of isoprene.Isoprene plays an important role in the formation of unhealthy levels of ozone – more important than anthropogenic VOCs, so

must decrease NO

x

to decrease ozone!

Ozone Monitoring Instrument (OMI) on the Aura satelliteSlide10

Nitrogen

dioxide is another precursor to ozone

NO

2

is an EPA criteria

pollutant as well.

Ozone Monitoring Instrument (OMI) on the Aura satelliteSlide11

11

2005

2010

Regulations of NO

x

Emissions are Working!

Ozone Monitoring Instrument (OMI) on the Aura satellite

NO

2

decreases by 20-50%Slide12

SO

2 Reductions over the Eastern US as Seen by OMI

Ozone Monitoring Instrument (OMI) on the Aura satellite

When combusted, coal with sulfur impurities leads to the formation of SO

2

– a precursor to acid rain and PM

2.5

.

2005-2007

2008-2010Slide13

And for perspective …

OMI measurements show that SO2

was very high in China (2005) and much lower over the Ohio valley in the US. The SO2

in China comes from power plants without scrubbers burning high sulfur coal. The 1971 Clean Air Act mandated scrubbers on US power plants built after 1977.

OMI SO

2

US Ohio Valley

OMI SO

2

China 2005 mean

0.0 0.05 0.1 0.15 0.2 0.25 0.3 0.35 0.4 0.45 0.5

SO2 Column (DU) Slide14

2008: Beijing Olympics, stringent emission control measures were enforced

Chinese SO

2

emission controls were strengthened by the 11th Five-Year-Plan that requires flue-gas desulfurization technology (FGD) on all new plants and some old ones. There is also better inspection and enforcement.

2009: Global economic crisis, reduce industrial activity and strict emission controls continue

2005-2007: increasing power plant emissions

Sulfur Dioxide

2005

2006

2007

2008

2009Slide15

The Impact of the 2005 Gulf Hurricanes

on NO

2

Difference in OMI NO

2

(Pre Katrina - Post Rita *)

x10

15

molec

/cm

2

Reductions in Oil & Gas Production

Destroyed Oil Platforms (

,

)

*

Pre Katrina = August 1 - 26

Post Rita = September 27 - October 17

Hurricanes Katrina and Rita caused a significant reduction in NO

2

emissions from oil and gas production facilities as well as power plants.

Katrina

Refineries

New Orleans

LA Offshore Oil Port reopened Nov. 5

th

Rita

Landfall

Sep. 24

th

Landfall

Aug. 29

th

Katrina

Rita

Wilma

Production [%]

DateSlide16

Wildfires & Agricultural Fires

Cold Front

Agricultural Fires

AOD

= Aerosol Optical Depth

the

degree to which aerosols prevent the transmission of light by absorption or scattering of light through the entire vertical column of the atmosphere from the ground to the satellite’s

sensor.

But how does satellite AOD (

unitless

) relate to “nose-level” PM

2.5

(

ug

/m

3

)?Slide17

PM

2.5 Estimation: Popular Methods

AOT

PM2.5

Y=mX + c

Difficulty LevelSlide18

Satellite-Derived PM

2.5 [ug/m3

]

18