/
COMMENTARY october   vol xlviI no  EPW Economic  Political Weekly  Where Do Indias Billionaires COMMENTARY october   vol xlviI no  EPW Economic  Political Weekly  Where Do Indias Billionaires

COMMENTARY october vol xlviI no EPW Economic Political Weekly Where Do Indias Billionaires - PDF document

sherrill-nordquist
sherrill-nordquist . @sherrill-nordquist
Follow
496 views
Uploaded On 2015-02-22

COMMENTARY october vol xlviI no EPW Economic Political Weekly Where Do Indias Billionaires - PPT Presentation

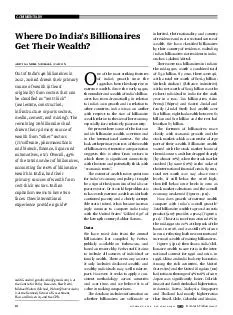
aditigmailcom is at the Centre for Policy Research New Delhi Michael Walton MichaelWaltonharvardedu is at the Kennedy School of Government Harvard University and the CPR Out of Indias 46 billionaires in 2012 20 had drawn their primary source of we ID: 38596

aditigmailcom the

Share:

Link:

Embed:

Download Presentation from below link

Download Pdf The PPT/PDF document "COMMENTARY october vol xlviI no EPW E..." is the property of its rightful owner. Permission is granted to download and print the materials on this web site for personal, non-commercial use only, and to display it on your personal computer provided you do not modify the materials and that you retain all copyright notices contained in the materials. By downloading content from our website, you accept the terms of this agreement.


Presentation Transcript

COMMENTARY october 6, 2012 vol xlviI no 40 EPW Economic & Political Weekly Where Do India’s Billionaires Get Their Wealth?Aditi Gandhi, Michael Walton Aditi Gandhi (gandhi.aditi@gmail.com) is at the Centre for Policy Research, New Delhi. Michael Walton (Michael_Walton@harvard.eduis at the Kennedy School of Government, Harvard University and the CPR.Out of India’s 46 billionaires in 2012, 20 had drawn their primary source of wealth (at least COMMENTARYEconomic & Political Weekly october 6, 2012 vol xlviI no 40 .9 .9 .4 .6 .6 .9 .5 .8 .3 .5 .6 1.4 2.2 .8 1.9 2.1 .9 0 5 0 5 1996 1997 1998 1999 2000 2001 2002 2003 2004 2005 2006 2007 2008 2009 2010 2011 2012Figure 2: The Ratio of Billionaire Wealth to GDP, 1996-2012 (%)Source: Forbes.com and World Economic Outlook, IMF.Figure 3: Billionaire Wealth as a Proportion of GDP across Economies, Over TimeAggregate Net Worth as a % Share of GDP in 1996 ARG RG BRA RA CHL HL HN COL OL CU ND IDN DN ISR SR PN WT YS EX RUS US SAU AU SGP GP KOR OR THA HA GBR BR SA EN 0 5,000 10,000 15,000 20,000 25,000 30,000 35,000 40,000 GDP Per Capita PPPAggregate Net Worth as a % Share of GDP in 2012 0 10,000 20,000 30,000 40,000 50,000 60,000 70,000 GDP Per Capita PPP ARG RG RA HL HN COL OL CU ND IDN DN ISR SR PN KOR OR WT YS EX RUS US SAU AU SGP GP THA HA GBR BR SA EN Source: Forbes.com and World Economic Outlook, IMF.countries notorious for their extreme levels of inequality. East Asian countries have often been characterised as paragons of “shared growth” (World Bank 1993). There were indeed sharp reductions in poverty incidence, but there was also accumulation of extreme wealth by busi-The picture changed dramatically by the 2000s. Billionaire wealth as a pro-portion of had fallen sharply in Indonesia, Korea and Thailand in the wake of the 1997-98 east Asian crisis – amidst a newly discovered concern with “crony capitalism”. By contrast, wealth in Chile, Mexico and Russia rose sub-stantially; Saudi Arabia and Kuwait ex-perienced some decline. Chile has a small number of very rich families in a relatively small country that has experi-enced rapid growth. Mexico is renowned for its billionaires, many of whom were created in the era of privatisations in the early 1990s; this in particular helped the business career of the world’s richest man Carlos Slim Helú. India is in inter-esting company. The ratio also rose in China, but much less than in India.Sources of WealthWe turn now to the sources of wealth of India’s billionaires from two perspectives: inheritance and sector of origin.Inherited and Self-made Wealth: Morck, Wolfenzon and Yeung (2005) note an interesting pattern across countries: they  nd a positive association between growth and self-made billionaire wealth, but a negative one with inherited wealth. While no causality can be inferred, this is aligned with the view that self-made wealth is more likely to be associated with aggregate economic dynamism.In addition to self-made and inherited, Forbes also has a category of “inherited and growing”, for billionaires who inherited their wealth but subsequently experienced substantial growth in wealth. Figure 4 (p 12) shows that while the largest number of Indian billionaires (21) is “self-made”, some 40% of total billionaire wealth is in the “inherited and growing” category, including, for example, Mukesh and Anil Ambani.Caste origins are also of interest for India. Damodaran (2008) has documented 25,00020,00015,00010,0005,000300250200150100Figure 1: Net Worth of Billionaires and the Stock Market 1997 1998 1999 2000 2001 2002 2003 2004 2005 2006 2007 2008 2009 2010 2011 2012Sensex (LHS)Aggregate Net Worth (RHS) Source: BSE database and Forbes.comSensex (High)Net Worth ($ bn) COMMENTARYoctober 6, 2012 vol xlviI no 40 EPW Economic & Political Weekly the importance of the route from India’s merchant castes to modern business wealth, but also found increasing entry into business activity from other groups: from brahmin and other upper castes (from “Of ce to Factory”) and from Other Backward Classes (from “Field to Factory”). This is evident in the billion-aire list: 28 of the 46 billionaires in 2012 are from traditional merchant classes – Banias (including Marwaris), Parsis and Sindhis. A number belong to upper caste communities, including brahmins (Mallya, Murthy) and Khatris (Thapar, Munjal, Mahindra). A smaller group comes from other backward and lower castes such as Nadar, Jat and Reddy. There is one Muslim and no dalit.Sectoral Sources of Wealth and ‘Eco-nomic Rents’: All of India’s billionaires are linked to corporate activity. There is an array of sectoral sources, including mining, energy, petrochemicals, phar-maceuticals, information technology, construction, real estate and  nance. This allows us to explore whether wealth had its origins in domains with extensive “economic rents” and links with government.By economic rent we mean a return to a factor of production in excess of what could be obtained from an alternative use in a fully competitive activity. Economic rents often  ow from monopolistic eco-nomic power or from the need to get licences from government. Natural re-sources, land, and the spectrum have intrinsic economic rents, and typically high levels of state control, as do a range of activities involving government contracts. There are also “Schumpeterian” economic rents associated with discovery and cre-ation of new products. India’s information technology revolution is often put in this category. The broader debate over whether India’s capitalism is heading towards oligarchic or competitive struc-tures is closely linked to what kind of economic rents are driving business activity. In the rest of this article we use rents to refer to the former category, associated with market power, in uence or preferential access to licensing.As a highly tentative exploration of patterns, we draw a distinction between activities in “rent-thick” sectors and “others” – even if they involve some inter-action with the state. The classi cation should be considered as a cautious  rst step. This draws on a survey of business views on corruption by KPGM (2011), an-ecdotal evidence on regulatory intensity, and reports of alleged scams.‘Rent-thick’: Sectors such as real estate, infrastructure, construction, mining, tele-com, cement and media have been clas-si ed as “rent-thick”, because of the per-vasive role of the state in giving licences, reputations of illegality, or information on monopolistic practices. The real estate sector is well known for the large number of “black” transactions, and the nexus between politicians and realtors has been documented in recent scams (e g, the Adarsh housing scam). Accord-ing to the KPMG study, the real estate sector is perceived to be the most corrupt in India.Infrastructure projects, mining and spectrum licence allocations are typically granted through invitation of bids by the government. Decisions have often been disputed on grounds of transgressions, such as the award of tenders for building airports at Mumbai and Delhi or the fa-mous 2 telecom spectrum allocation, now the subject of trial over bribes.Cement manufacturers have allegedly been involved in a cartel for almost two decades. In 2007 the Monopolies and Restrictive Trade Practices Commission initiated an investigation and a  ne was eventually imposed in 2012. Indian print media is deeply embroiled in the paid news scandal, and the Press Commission of India launched an investigation after the 2009 elections. It is alleged that the released version of the report omitted the names of the implicated companies.‘Others’: This category covers sectors where the interaction with the state is more limited, the regulator has a good reputation and there is little anecdotal evidence of scams. Sectors include /soft-ware, engineering sector  rms, pharma-ceuticals,  nance and banking. Many corporations in this category do have some form of agreement with the government. For example, technology  rms (Wipro, HCL and Infosys) have been involved in various state and central government projects under the National e-Governance Plan. Engineering  rms often provide equipment to government departments or public sector units. Two  rms, Torrent Group and RPG Group, have diversibusiness activities into power and have supply agreements with government. Another company, Serum Institute has a vaccine supply agreement with govern-ment (and is also involved in liquor). Yet the core business of these  rms is not driven by government contracts.Also included in “others” are pharma-ceuticals, chemicals, light engineering and  nance and banking  rms. Pharma-ceutical companies are often in legal battles with one another, but interac-tions with government are more infre-quent. Despite cases of accounting or trading violations, the  nancial sector is generally thought to be tightly regulated by the Securities and Exchange Board of India (SEBI) or the Reserve Bank of India. Other manufacturing  rms also now require fewer permissions from the state; we include in this category automobiles, the leading paints manufacturer Asian Paints and the conglomerate Spice group ing mobile, retail, etc. Proportion of wealth Proportion of wealth Number of Billionaires (RHS) Number of Billionaires (RHS) Inherited Inherited and Growing Self-madeFigure 4: The Distribution of the Number and Wealth of Billionaires in Terms of ‘Inherited’, ‘Inherited and Growing’ and ‘Self-made’(in %) Proportion of wealthNumber of Billionaires (RHS)Source: Author’s estimates from Forbes.comPermission for Reproduction of Articles Published in EPW No article published in EPW or part thereof should be reproduced in any form without prior permission of the author(s). A soft/hard copy of the author(s)’s approval should be sent to EPWIn cases where the email address of the author has not been published along with the articles, EPW can be contacted for help. COMMENTARYEconomic & Political Weekly october 6, 2012 vol xlviI no 40 Patterns The above, preliminary and tentative, categorisation generates the following pattern in 2012 (details available from the authors on request): Twenty billionaires had their primary source of wealth (at least originally) from sectors classi ed as “rent-thick”: seven from the real estate, construction, infra-structure or ports sectors, three from media and the rest from cement and mining. Twenty-six billionaires had their primary source of wealth from “other” sectors: six from /software industry, eight from pharmaceuticals and biotech, two from  nance or banking, one from liquor and nine from manufacturing , mobiles, electronics, paints, etc). Overall, 43% of the total number of billionaires, accounting for 60% of billion-aire wealth, had their primary sources of wealth from rent-thick sectors (Figure 5).We also looked at changes over time: in the early 2000s, the proportion of wealth from the sectors classi ed as “others” rose, while wealth from billionaires in “rent-thick” sectors shifted back to dominance in the second half of the 2000s (Figure 6). There are many caveats around this exercise, both in the allocation of sectors and of billionaires to sectors. Classi ca-tion in a rent-thick sector does not nec-essarily mean that wealth was acquired through the (legal or illegal) exercise of in uence. However, it is notable that impressive wealth creation occurred in sectors with substantial potential for rent-extraction and rent-sharing between private and government players.Business Dynamism or Oligarchy?Does the rise in the billionaire class herald enhanced business dynamism or a business oligarchy? Do these results have a larger signi cance? In particular, did the opening of the economy contribute to the entrenchment of incumbents in the Indian business sector or unleash dynamic, competitive forces? There is a case for both.The corporate sector has clearly played a critical role in India’s economic growth. The share of investment in rose from around 25% in 2000 to around 35% in 2010, with a substantial rise in the share of the private corporate sector. Mody, Nath and Walton (2011) provide empirical evidence to support the view that pro t behaviour of listed  rms in the corporate sector – including the large business houses – is more typical of competitive behaviour than of the ex-ercise of market power.On the other hand, the recent string of scams points to widespread existence of corruption, with anecdotal evidence sug-gesting that the links between the govern-ment and the business sector remain strong. Indian capitalism seems to have two faces. Does international experience provide a guide?We saw above that east Asian miracle countries also experienced a combination of corporate dynamism, accusations of cronyism and concentrations of extreme wealth. This mix was viable for a while – though these countries did a much better job than India in channelling the gains from growth into broad-based service ever, the cronyism was a rising source of distortion and contributed to the east Asian crisis.Mexico, amongst Latin American countries, is a classic case of tight state-corporate links creating extreme business wealth. The Mexican business sector is much more oligopolistic than India’s, but the in uence of big business over the Mexican state is a salutary lesson. It, in particular, shows how high domestic rents and market power can be consistent with internationally competitive compa-nies: Mexican  rms in telecoms and cement are also ef cient global players, pushing for competition abroad and resisting it at home.The Robber Barons of the gilded age were eventually brought under a degree of economic control via the anti-trust movement – though not before they had become enormously wealthy. This movement involved an effective alliance between a populist political movement and a strong executive, supported by action of the judiciary. India certainly has popular mobilisation against corrup-tion, but it is not at all clear that the state has the capacity to manage the econom-ic power of a rising corporate sector. ConclusionsThe interaction between the corporate sector and the state is an unavoidable feature of capitalism. In the past two to three decades this has bred both impressive business dynamism and even Figure 5: Proportion of Billionaires and Total Billionaire Wealth by ‘Rent-Thick’ or Otherwise in 2012Number of Billionaires Wealth of Billionaires Source: Forbes.com and author’s calculations. Rent thick43%Rent thick Others40%OthersFigure 6: Distribution of Wealth of Billionaires by Sources of Wealth between 1996 and 2012 100 1996 1997 1998 1999 2000 2001 2002 2003 2004 2005 2006 2007 2008 2009 2010 2011 2012OthersRent thick Source: Author’s estimates from Forbes.com available atDelhi Magazine Distributors Pvt Ltd110, Bangla Sahib Marg New Delhi 110 001Ph: 41561062/63 COMMENTARYoctober 6, 2012 vol xlviI no 40 EPW Economic & Political Weekly more impressive accumulation of extreme wealth in India. There is a real question as to whether an oligarchic business structure and a corruptible state will lead to the propagation of inequality and create distortions that hurt the growth process. This is not necessary, as illus-trated by the reform experience in the  rst part of the last century – though the more recent experience with the nancial crisis shows that the effective regulation of capitalism continues to be a major issue. The rise of India’s businesses on the global stage can be consistent with a murky domestic scene. Which path India follows will have a powerful in uence on growth, inequality and the nature of the state.Notes1 This is a ratio of a stock (of wealth) to a  ow (of national income). Changes in this ratio will move with the underlying ratio of the share of billionaire to total Indian wealth, to the extent that aggregate income to wealth ratio remains constant, or changes slowly.2 Measures of income or expenditure inequality from household surveys are generally higher in these Latin American countries than in the Asian counterparts.3 The classi cation is taken from the latest avail-able list. For example, if a billionaire featured in the 2008 list prior to the 2012 list, 2008 clas-si cation has been used. Classi cation for two billionaires was not available. The classi cation has been done subjectively based on trends.4 See Walton (2012).5 http://www.kpmg.com/IN/en/IssuesAndInsights/ ArticlesPublications/Documents/KPMG_Brib-ery_Survey_Report_new.pdf6 http://www.outlookindia.com/article.aspx? 2301527 http://www.outlookindia.com/article.aspx? 2352878 http://www.outlookindia.com/article.aspx? 266542ReferencesBombay Stock Exchange (2011): BSE database (http://www.bseindia.com/stockinfo/indices.aspx).Damodaran, Harish (2008): India’s New Capitalists – Caste, Business and Industry in a Modern Nation (New Delhi: Permanent Black).Forbes (2012): “The World’s Billionaires”, downloaded on April 2012 (http://www.forbes.com/billion-aires/list/).KPMG (2011): Corruption and Bribery Survey 2011: Impact on Economy and Business Environment, KPMG. Mody, Ashoka, Anusha Nath and Michael Walton (2011): “Sources of Corporate Pro ts in India: Business Dynamism or Advantages of Entrench-ment?” in Suman Bery, Barry Bosworth and Arvind Panagariya (ed.), India Policy Forum 2010-11 Volume 7 (New Delhi: Sage).Morck, Randall, Daniel Wolfenzon and Bernard Yeung (2005): “Corporate Governance, Eco-nomic Entrenchment and Growth”, Journal of Economic Literature, 43: 657-722Roy, Saumya (2006): “The Tarmac Is Grey”, Out-lookindia.com (13 February), viewed on 2 Sep-tember 2011 (http://www.outlookindia.com/article.aspx?230152).Srivastava, Shuchi (2007): “Shots or Mortar”, Out-lookindia.com (13 August), viewed on 5 Sep-tember 2011 (http://www.outlookindia.com/article.aspx?235287).Thakurta, Paranjoy Guha and K Sreenivas Reddy (2010): “ ‘Paid News’: The Buried Report”, Outlookindia.com(6 August), viewed on 5 Sept-ember 2011 (http://www.outlookindia.com/article.aspx?266542).Walton, Michael (2012): Inequality, Rents and the Long-run Transformation of India (Bangalore: Institute for Social and Economic Change).World Bank (1993): The East Asian Miracle, World Bank, Washington DC. Research Foundation ts.in, for a limited period of at a very moderate and uniform (against the current annual subscription ranging from Rs. 24,000 September to 20 November 2012(i) Financial Markets (v) Agricultural Statistics (ix) Combined Government Finances(ii) Banking Statistics (vi) Power Sector (x) National Accounts Statistics(vii) Industrial Production (xi) Annual Survey of Industries(iv) Price Indices (viii) Finances of State Governments (xii) External Sector (xiii) Finances of Government of India Ease in identifying the variables. Versatility in selecting data variable/series as per requirement and download at ease as designed to Convenience of exporting the required data-set to Excel les. Instantly compare and analyze different data in relation to each other and if required can print the data.Enhancing Research cations, please contact: ts.in