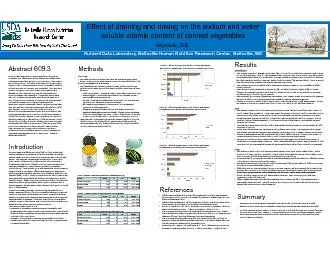
/
Effect of draining and rinsing on the sodium and water soluble vitamin Effect of draining and rinsing on the sodium and water soluble vitamin

Effect of draining and rinsing on the sodium and water soluble vitamin - PDF document

sherrill-nordquist
sherrill-nordquist . @sherrill-nordquist
Follow
406 views
Uploaded On 2015-10-13

Effect of draining and rinsing on the sodium and water soluble vitamin - PPT Presentation

Haytowitz DB Nutrient Data Laborator y Beltsville Human Nutrition Research Center Beltsville MDPublic health advocates are urging people to reduce their sodium intake While many manufacturers ID: 159500

Haytowitz D.B Nutrient Data Laborator y Beltsville

Share:

Link:

Embed:

Download Presentation from below link

Download Pdf The PPT/PDF document "Effect of draining and rinsing on the so..." is the property of its rightful owner. Permission is granted to download and print the materials on this web site for personal, non-commercial use only, and to display it on your personal computer provided you do not modify the materials and that you retain all copyright notices contained in the materials. By downloading content from our website, you accept the terms of this agreement.


Presentation Transcript

Effect of draining and rinsing on the sodium and water soluble vitamin content of canned vegetables Haytowitz, D.B Nutrient Data Laborator y , Beltsville Human Nutrition Research Center, Beltsville, MDPublic health advocates are urging people to reduce their sodium intake. While many manufacturers are reducing the sodium content of their p roducts consumers can also reduce Green Beans: •The sodium content of 3 brands ranged from 189 –219 mg/100 g of total can contents, with a mean of 205 ±8.3 mg/100g (Table 1). This compares with a current value of 259 mg/100 g in SR23 and a current mean label claim of 325 mg/100g. One store brand contained 2 mg sodium/100 g, although the label stated 400 mg/120 g serving. As this could be labeled “No Sodium Added”, it was removed flllltiildithfftfdiidii Sampling: •Two national brands and two, store brands, of canned corn, green and p eas were p urchased in g rocer stores in Blacksbur g, VA.. Figure 1. Effect of preparation on the sodium, potassium, phosphorus, magnesium, and calcium in canned green beans p, the sodium content. The effect of draining and rinsing before heating on the sodium content of canned vegetables, and that of other minerals and vitamins was evaluated. Four brands of canned corn, peas, and green beans were purchased in Minimalsodium waslostafterdrainingthegreenbeans;after f rom a ll ca l cu ons, nc e e ff ec d i ng an d r ng. •The sodium content was reduced 2% by draining the total can contents, and an additional 7% by rinsing (Figure 2).•The calcium content increased on draining (39%), and then decreased slightly (8%) on rinsing. However the calcium content of green beans is relatively low (25 mg/100 g) for total can contents, contributing only 3% of the DV per serving.•Other minerals (potassium, phosphorus, magnesium, zinc, copper, and manganese) and B vitamins (thiamin, riboflavin, and niacin) changed only slightly during the various treatments.•Vitamin C decreased slightly (3%) during draining, and somewhat more (6%) during rinsing. Again, the vitamin C content of canned green beans is low—3.6 mg/100 g for total can contents. ,ppgyg, Sample preparation and analysis:•The Food Analysis Laboratory Control Center (FALCC) at Virginia Tech measured and prepared the foods as follows after removal from the cans:•Total can contents –vegetables and packing liquid were measured•Drained solids –vegetables were drained for 2 minutes using a standard #8 sieve and weighed•Rinsed –Drained vegetables were rinsed with 3.5 L of lukewarm tap water and allowed to drain for 2 minutes. •All samples were weighed, homogenized, and composited according to NDL instructions. •Aliquots were packed under nitrogen and shipped frozen to analyticallabsundercontracttoUSDAVitaminCwasanalyzed Figure 2. Effect of preparation on the sodium, potassium, phosphorus, magnesium, and calcium in canned corn Minimal sodium after beans; after rinsing, sodium fell from 231 mg/100 g (total can contents) to 214 mg/100 g (7%). Sodium in corn went from 205 mg/100 g (total can contents) to 185 mg/100 g (10%) on draining and to 162 mg/100 g (12%) on rinsing. Vitamin C was also lost with both treatments; 10% in green beans; 21% in corn, and 6% in peas; other nutrients were also evaluated. Based on this study, draining and rinsing can be effective in reducing sodium in canned vegetables; however, varying amounts of some water-soluble nutrients may also be lost. Funding: ARS/USDA and NIH.205 ±12.8 mg/100 g (Table 2). This compares to the current value of 213 mg/100 g in SR23 and a current mean label claim of 279 mg/100 g. Of t analytical contract . Vitamin C analyzed at Virginia Tech (Nishiyamaet al., J. Agric. Food Chem. 52 (2004) p. 5472-5; and Phillips et al., Food Chem. 92 (2005) p. 587-95).•Samples were analyzed for proximates(nitrogen, AOAC 991.20; fat, AOAC 933.05; ash, AOAC 945.46; and moisture, AOAC 964.22), minerals (AOAC 985.01), thiamin (AOAC 942.23), riboflavin (AOAC 970.65), and niacin (AOAC 944.13). A recent Institute of Medicine report(IOM, 2010a), linked high sodium intakes to hypertension and advocated steps to reduce bfdd didtlldiitkht on rinsing, but is not present at nutritionally significant levels (0.94 mg/100 g for total can contents). •The sodium content of 4 brands of canned sweet peas ranged from 210 to 328 mg/100 g, with a mean of 261 ±26.7 mg/100 g (Table 3). This is slightly lower than the current value in SR23 of 250 mg/100 g and 8% lower than the mean label value of 283 mg/100 g. •Draining the total can contents resulted in a sodium reduction of 5%; an additional 7% of the sodium in the drained solids was removed by rinsing.•The potassium content changed only slightly on draining (1%) and an additional 5% lost on rinsing; the values are not nutritionally significant. •While the levels of some minerals (calcium, iron, zinc, copper, and manganese) did change during draining, they changed only slightly on rinsing and were not found at nutritionally significant levels. Otherminerals(magnesiumandphosphorus)onlychangedslightlyduringbothtreatments Figure 3. Effect of preparation on the sodium, potassium, phosphorus, magnesium, and calcium in canned peas Table 1. Sodium Content of Canned Green Beans (mg/100 g)FoodMeannS.D.*RangeSolids and liquids235312.8215 –259Drained solids231318.3211 –268Rinsed214321.4178 –252Table 2. Sodium Content of Canned Sweet Corn (mg/100 g)FoodMeannS.D.*RangeSolids and liquids20538.7189 –219Drained solids18639.9172 –205 er o f re d uce -so um pro d uc s, overa ll so di um t a k as no t changed (IOM, 2010b). Some speculate that this may be due to the perception that such products do not have the same flavor as the original product. While some companies have worked to reduce the sodium content of their products, others have not, fearing that if their competitors did not make similar changes, their products would be at a disadvantage. Canned vegetables currently average 240 mg sodium/100 g solids. Simarand Mason (1975) examined the effect of rinsing and cooking in tap water on the sodium content of cooked vegetables, but did not examine the effect of these treatments on other minerals and water-soluble vitamins. Vermulen(1983) examined the effect of rinsing on the calcium and sodium content of canned green •IOM (Institute of Medicine). 2010a. A Population-Based Policy and Systems Change Approach to Prevent and Control Hypertension. Washington, DC: The National Academies Press. Other minerals (magnesium phosphorus) changed treatments •About 5% of the vitamin C was lost during both treatments. One serving of peas (total can contents) provide 16% of the DV.•While a substantial amount of riboflavin was lost during draining (66%), it was not present at a nutritionally significant level. Other B vitamins, also not present at nutritionally significant levels, showed little change during either treatment. Drainingandrinsingofcannedvegetablescanreducethesodiumcontentfrom9 - Rinsed163314.0137 –185Table 3. Sodium Content of Canned Sweet Peas (mg/100 g)FoodMeannS.D.*RangeSolids and liquids261426.7210 –328Drained solids249423.3211 –308Rinsed231415.5207 –275beans, but did not look at wate r -soluble vitamins. The objective of this study was to •Determine if the sodium content of canned vegetables had changed since the existing data for these vegetables in the USDA National Nutrient Database for Standard Reference (SR) was first collected in the early 1980s; Draining rinsing canned vegetables can reduce sodium content from 9 •Analytical values for the three vegetables tested were lower than that declared on the label.•Of all the nutrients tested, vitamin C decreased from 5-28% with draining and rinsing. However, for green beans and corn, vitamin C is not present in nutritionally significant amounts. Slight decreases for some other nutrients were not generally significant due to the usual low levels found in these vegetables.