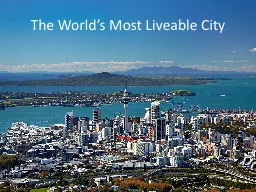
Liveable City D espite the technological breakthroughs that have caused the death of distance it turns out that the world isnt flat its paved The city has triumphed Glaeser ID: 333065
Download Presentation The PPT/PDF document "The World’s Most" is the property of its rightful owner. Permission is granted to download and print the materials on this web site for personal, non-commercial use only, and to display it on your personal computer provided you do not modify the materials and that you retain all copyright notices contained in the materials. By downloading content from our website, you accept the terms of this agreement.
Slide1
The World’s Most
Liveable
CitySlide2
“
D
espite
the technological breakthroughs that have caused the death of distance, it turns out that the world isn’t flat, it’s paved.
The city has triumphed”
Glaeser
, 2010Slide3Slide4
Liveable
for who?
Largest New Zealand regions
Source: Statistics New ZealandSlide5
An additional person every …
Source: Statistics New Zealand, Auckland Council calculationsSlide6
The lure of Auckland . . .
Source: Statistics New ZealandSlide7
Mercer
Liveability
SurveySlide8
Regional GDP per capita in Asia-Pacific region
Source: OECD Regions at a Glance 2011
North Island = 56
th
South Island = 64
thSlide9Slide10
The GFC and GDP per capita
Auckland real GDP per capita
Source: Statistics NZ,
Infometrics
Year to Sep. 2012:
Auckland GDP per capita = $50,200
$7,100 gapSlide11
Our economic targets:
- A 5% PLUS INCREASE IN REAL GDP
A
6% PLUS INCREASE IN REGIONAL EXPORTS
A
5% PLUS INCREASE IN REAL GDP
A 2% PLUS INCREASE IN PRODUCTIVITY GROWTHSlide12Slide13
Unemployment rate
Auckland & New Zealand
Source: Statistics New Zealand
Year to Dec. 2012:
Auckland 7.7%
RoNZ 6.5%
NZ Treasury forecasts:
2013 5.8%
2014 5.3%
2015 5.0%
4.7%Slide14
Unemployment by qualification
Auckland, annual average
Source: Statistics New ZealandSlide15
Public services and transport criteriaSlide16
International competitiveness
The
2010/11 Global Competitiveness Report highlighted inadequate infrastructure as the biggest problem facing businesses in New
ZealandSlide17
Aotea Station
Under Albert St between Victoria & Wellesley streets
18 metres underground
Entries on Wellesley & Victoria streets
Newton Station
Under Symonds St between Newton Rd & Mt Eden Rd
43 metres
underground
Entries on Mt Eden Rd & Symonds St
K Road Station
Under Pitt St between Beresford Square & K Rd
35 metres underground
Entry on Beresford Square
City Rail Link Stations & Parnell
Parnell Station
Near Mainline Steam
Opens Sept. 2012
Access to Parnell & UniversitySlide18
City Rail Link Transport BenefitsSlide19
How short sighted are we?
United Kingdom
vs
New Zealand approach
Long lived projects dramatically more viableSlide20
CongestionSlide21
Auckland Productivity Premium
The geography of economic activity matters
Source: MOTUSlide22
“A material measure of wellbeing such as GDP … is an insufficient index for measuring aggregate wellbeing”
Grimes, 2012Slide23Slide24
“The top 1 percent gained 93 percent of the additional income created in the country in 2010”
Joseph
Stiglitz
, 2012Slide25
Wealth/Jobs
Transport
Environment
Inequality
Sustainable future