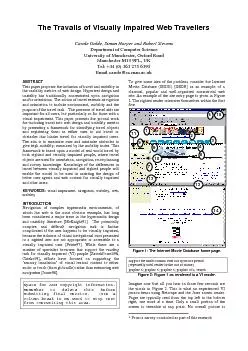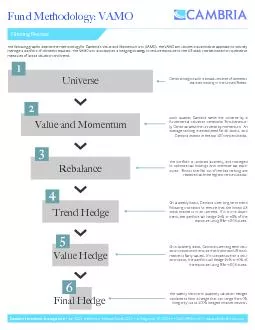
Cambria Investment Management 149 LP 2321 Rosecrans Avenue Suite 3225 El Segundo CA 90245 310 6835500 wwwcambriafundscom Cambria begins with a broad universe of domestic equities trading in ID: 833329
Download The PPT/PDF document "Filtering ProcessThe following graphic d..." is the property of its rightful owner. Permission is granted to download and print the materials on this web site for personal, non-commercial use only, and to display it on your personal computer provided you do not modify the materials and that you retain all copyright notices contained in the materials. By downloading content from our website, you accept the terms of this agreement.